


Audience
Educators
Grade Levels
Grades 9-12
Subject
Earth Science, Mathematics, Weather and Climate, Measurement and Data Analysis
Type
Data Sets
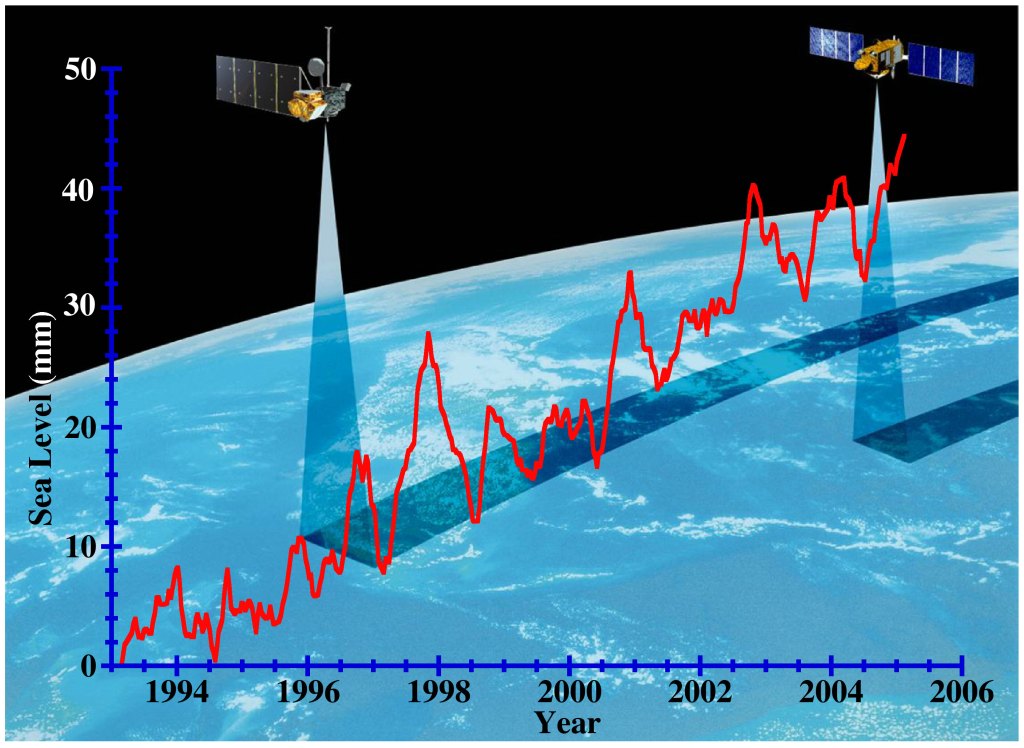
This Sea Level Height data set records global mean sea level (GMSL) change since 1993, as observed by satellites. GMSL is the average height of the entire ocean surface and is an important climate indicator. GMSL rise is caused primarily by two factors: added water from melting land-based ice sheets and glaciers, and the thermal expansion of seawater as it warms. Global sea levels have been rising for decades in response to a warming climate, and that rise appears to be accelerating.
DATASHEET: Global Mean Sea Level Variation (1993-2022) Dataset
Sea Level Height Data Spreadsheet
Related Resource
High Tide Flooding – Sea level rise is often spoken of in future terms, including projections for impacts we’re likely to see by the end of the century. But in many communities in the U.S., sea level rise is already a factor in people’s lives in the form of high-tide flooding. Also known as sunny day or nuisance flooding, this flooding can occur when slightly higher sea levels – due to melting glaciers and ice sheets, as well as the water in the oceans expanding when it gets warmer – meet a particularly high tide or moderate onshore breeze.
We visit Annapolis, Maryland, a state capitol, home of the U.S. Naval Academy, and seaside tourist town that has seen a dramatic increase in floods in recent years. Waters sometimes breach flood walls, or more often, back up through storm sewers to flood nearby streets. City engineers and a Naval Academy team, working with data from NOAA and NASA, are already working on flood mitigation efforts.
Annapolis is not alone in its planning for a more flood-prone future. Cities like Boston; New York; Philadelphia; Norfolk, Virginia; Charleston, South Carolina; Savannah, Georgia; and Miami are also faced with increased flooding or flood potential.