Water is so commonplace that we often take it for granted. But too much – or too little of it – makes headlines.
Catastrophic flooding in the U.S. Midwest this spring has caused billions of dollars in damage and wreaked havoc with crops, after rain tipped off a mass melting of snow. Seven years of California drought so debilitating that it led to water rationing came to a close after a wet and snowy winter capped off several years of slow rebound and replenished the vital mountain snowpack.
Half a world away, drought in eastern Australia so depleted the wheat crop that it had to be imported for the first time in 12 years. In eastern Africa and the Middle East, some of the most severe drought conditions on Earth are contributing to stressed crops across Somalia, Sudan, and Yemen.
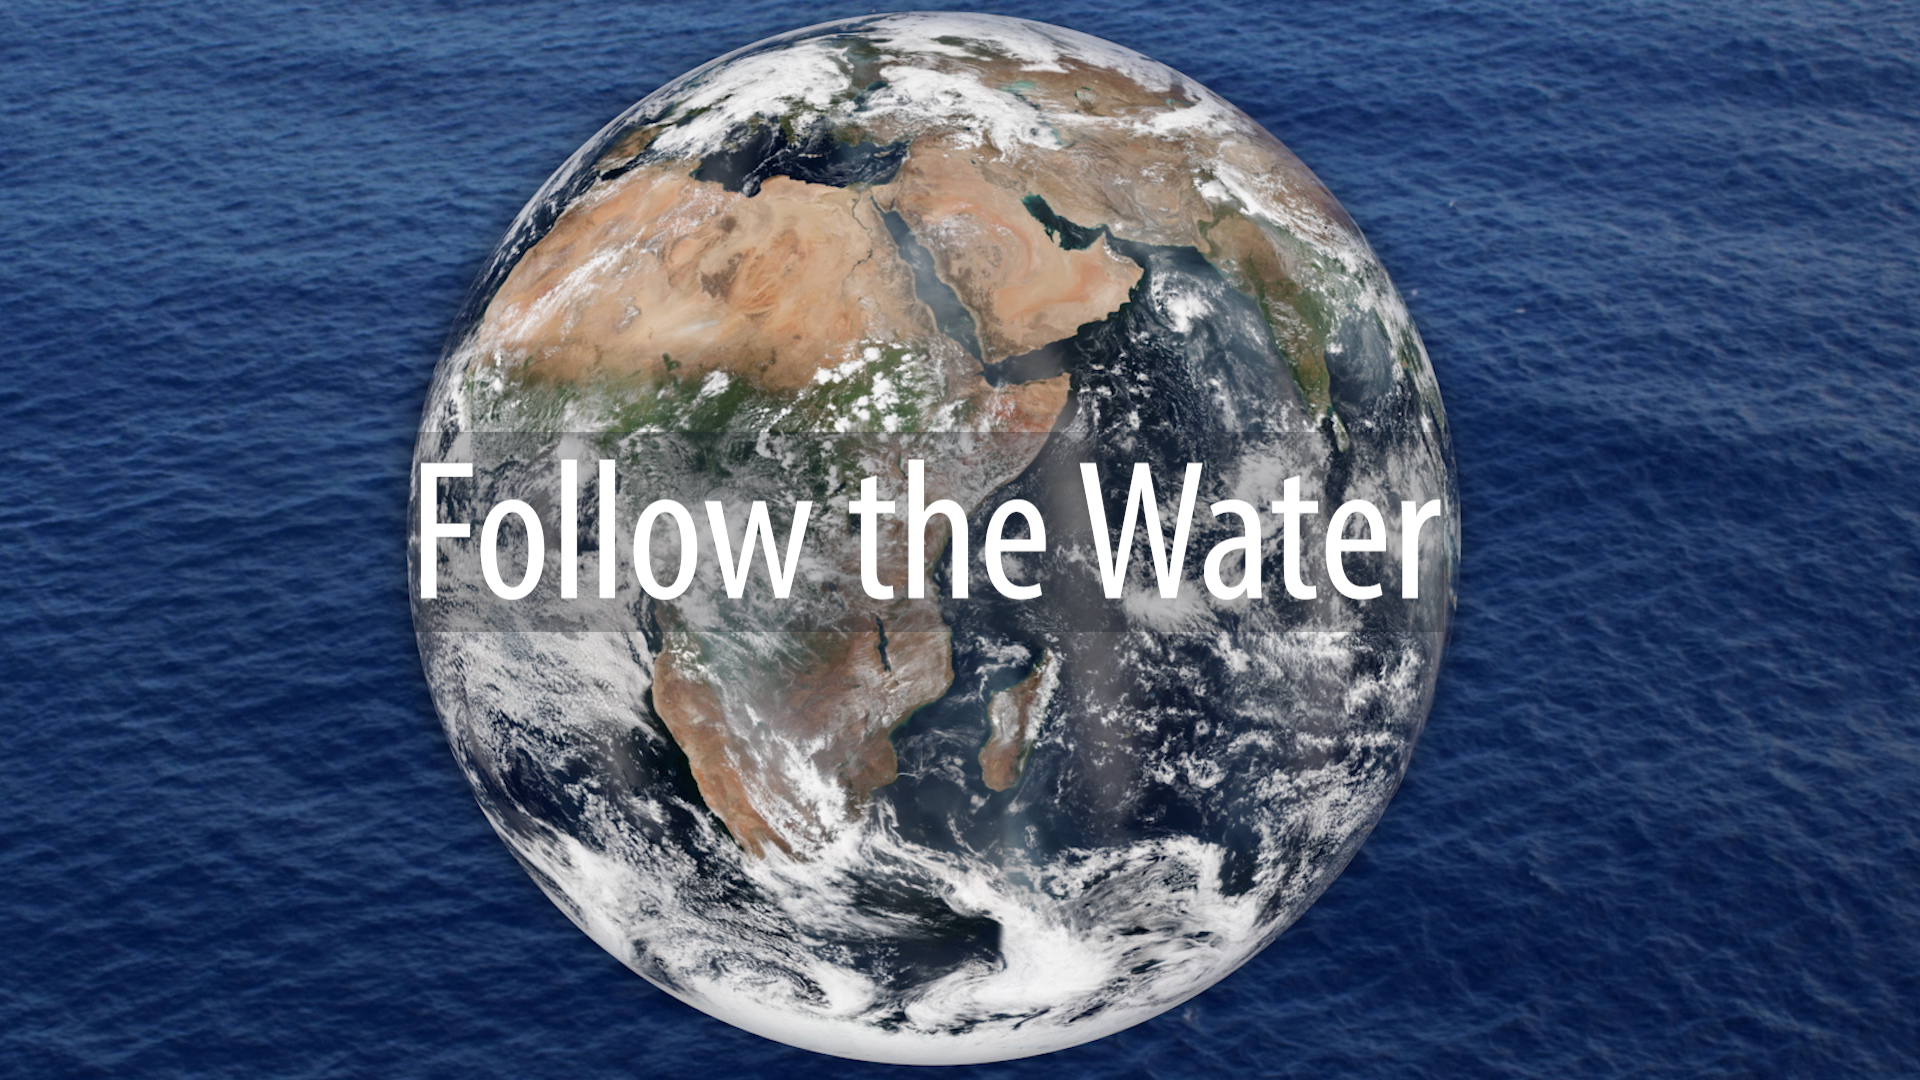
Whether concerned with floods, droughts, or the status and quality of water supplies, addressing the water-related needs of humans on Earth starts with knowing where the water is. With unique views from space, NASA is at the forefront of studying and monitoring this most precious resource that is constantly on the move. Researchers use data from satellites, aircraft, and other efforts, to find out where and when water is available around the globe, how much, and how are those patterns changing. They then figure out how to best use that data and get it into the hands of the people who need it most.
Over the next few weeks, we’ll be exploring areas of NASA research into Earth’s freshwater and surveying how those advances help people solve real world problems.
NASA and its partners are using satellites to revolutionize our ability to track and understand the flow of freshwater around Earth – whether it is in the atmosphere, at the Earth’s surface, or underground. In the last two decades, freely available NASA datasets have been used for extensive research into the movement, distribution, and interaction of each part of the water cycle worldwide.
It’s a complex cycle: Evaporating from warm tropical oceans, freshwater condenses into clouds, circulating on the winds where a portion of it falls as rain or snow. On the ground, freshwater is stored in ice, snow, rivers and lakes. Or, it soaks into the ground, disappearing from view to infiltrate into soils and aquifers. Or, before it disappears from view, it can evaporate back to the atmosphere, where moisture is tightly related to Earth’s energy flow, which in turn influences weather patterns that govern freshwater’s distribution.
“Fresh water is critically important to humans, both in obvious ways and in unseen ways such as moving heat around Earth’s entire climate system,” said Jared Entin, terrestrial hydrology program manager in the Earth Science Division at NASA Headquarters, Washington. “With our current satellites, we are now making great progress in pinning down both the detail needed for local water decisions and the global view essential to better understanding our changing climate.”
Researchers funded by NASA have used satellite and airborne data to better inform existing tools for flooding, drought forecasts and famine relief efforts, and for planning and monitoring regional water supplies. These efforts are tackling some of the most pressing needs of people around the world.
These efforts are shaped by local geography and specific user needs to ensure they address freshwater data that are most valuable to communities. For this reason, NASA supports a number of water-management applications that are customized to support different regions. For example, NASA’s Western Water Applications Office works with various entities in the western U.S., including state governments, tribal nations, and private industries to track the impacts of drought on agriculture and general water supplies. Abroad, NASA partners with the U.S. Agency for International Development through the SERVIR program to provide satellite data, computing tools, and training to local partners that improve local flood forecasting in Africa and assess climate impacts on mountain snow packs in the Himalayas, among other efforts.
These programs are but a few examples of many NASA-supported projects. Hundreds of other researchers, government agencies, and non-profits develop their own water-management tools and applications using NASA’s free and open datasets.
Credits: NASA’s Goddard Space Flight Center/SVS/Trent L. Schindler
Water from Snow
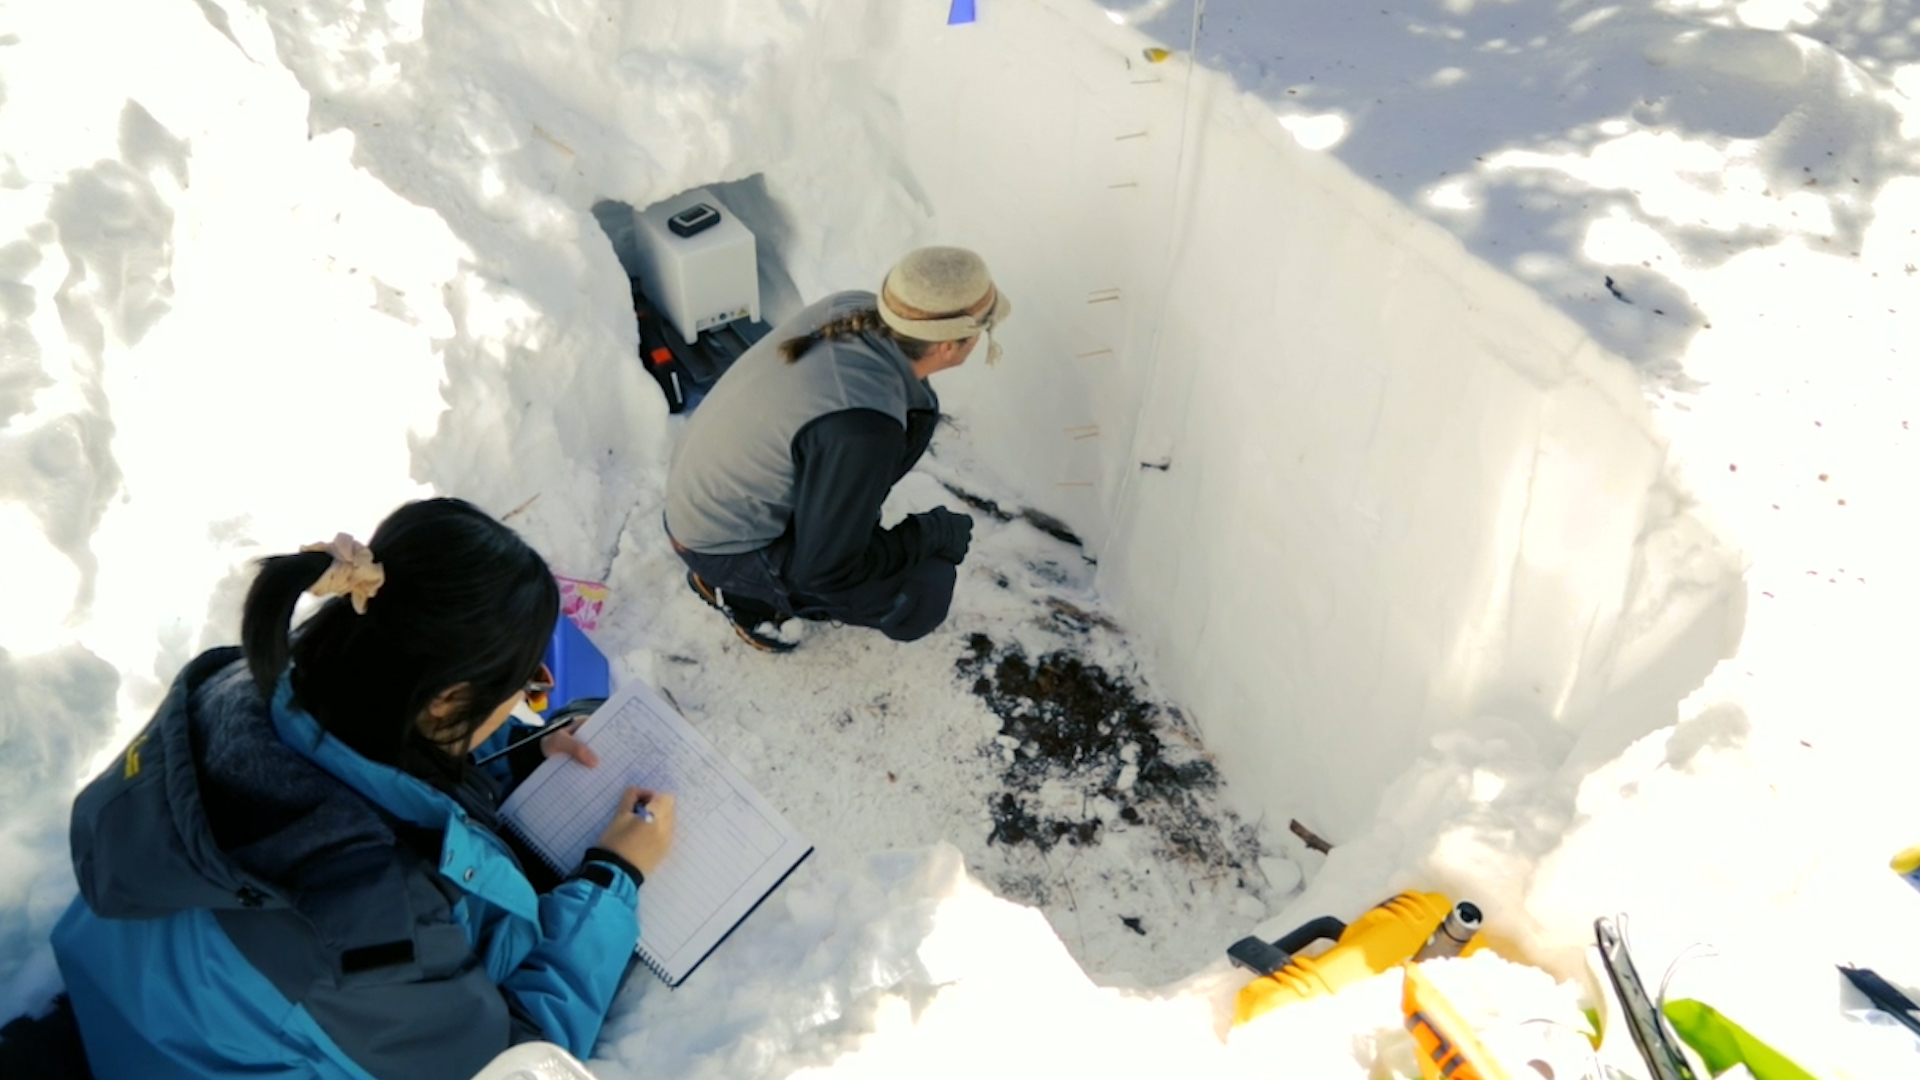
NASA is improving on existing and developing new remote sensing methods that can reveal how much water is stored in mountain and seasonal snowpack – one of the world’s most vital sources of freshwater. More than a billion people, spanning multiple continents, rely on water from mountain snow for their water supplies that support drinking water, farming, and even hydroelectric power. Snowfall patterns shift over time, however, both year-to-year from natural variability and due to long-term climate effects. With persistent human demands, the ability to accurately measure how much water is in mountain snowpack becomes an even more critical capability.
Through the Airborne Snow Observatory program, NASA and California’s Department of Water Resources use instruments mounted on airplanes to create high resolution estimates of snow water content for priority watersheds in the Western U.S. The collected data helps determine the timing of the spring melt, which has downstream effects on hydroelectric power generation and planning for how much water can be held in reservoirs.
NASA is also focused on the long-term development of tools to measure water in snow through an airborne field campaign called SnowEx. This type of field campaign connects detailed measurements of snow in the Colorado Rocky Mountains taken by researchers on the ground to remote sensing observations made by aircraft flying over the ground sites. The connections made from these highly detailed datasets will help scientists design future satellite missions that will make similar measurements from space.
Airborne snow measurements, as well as other programs, complement long-term regional observations from NASA satellites that create estimates for entire mountain ranges in the Western U.S. and around the world.
Credits: NASA’s Goddard Space Flight Center/SVS/Trent L. Schindler
Water in the Sky
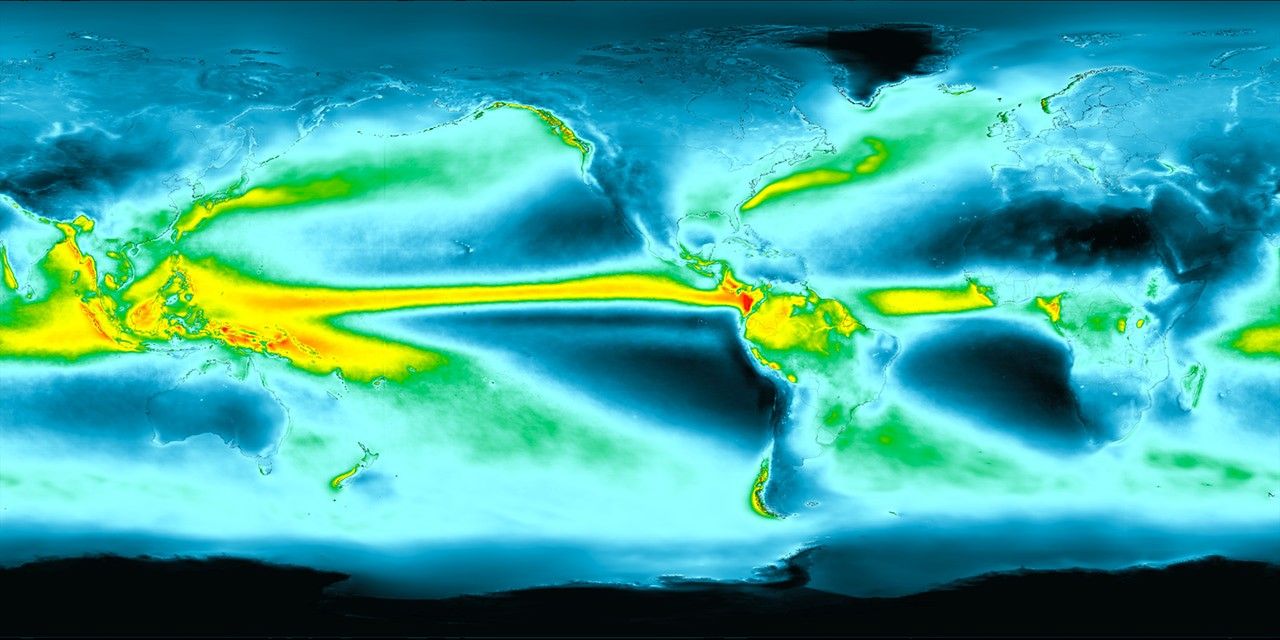
When we think of water on Earth we may think of the ocean, rivers and lakes. But as water cycles around the planet, the atmosphere holds moisture, creating a reservoir in the sky that periodically condenses into rain and snow. NASA is part of a team from more than a dozen countries whose satellites are working together to deliver global rainfall data every half hour. Over land, rain has immediate impact as it soaks into the ground, which supports crops.
Rainfall data is one of the most essentia toolsl for monitoring freshwater’s movement around the planet, and goes into applications that touch people’s everyday lives, including weather forecasting, crop monitoring, and flood prediction. For many parts of the world, especially developing countries and hard-to-reach terrain where ground measurements are sparse to non-existent, these global NASA datasets are sometimes the only consistent source of information on rainfall and soil moisture.
Credits: NASA’s Goddard Space Flight Center/SVS/Trent L. Schindler
Water from Below
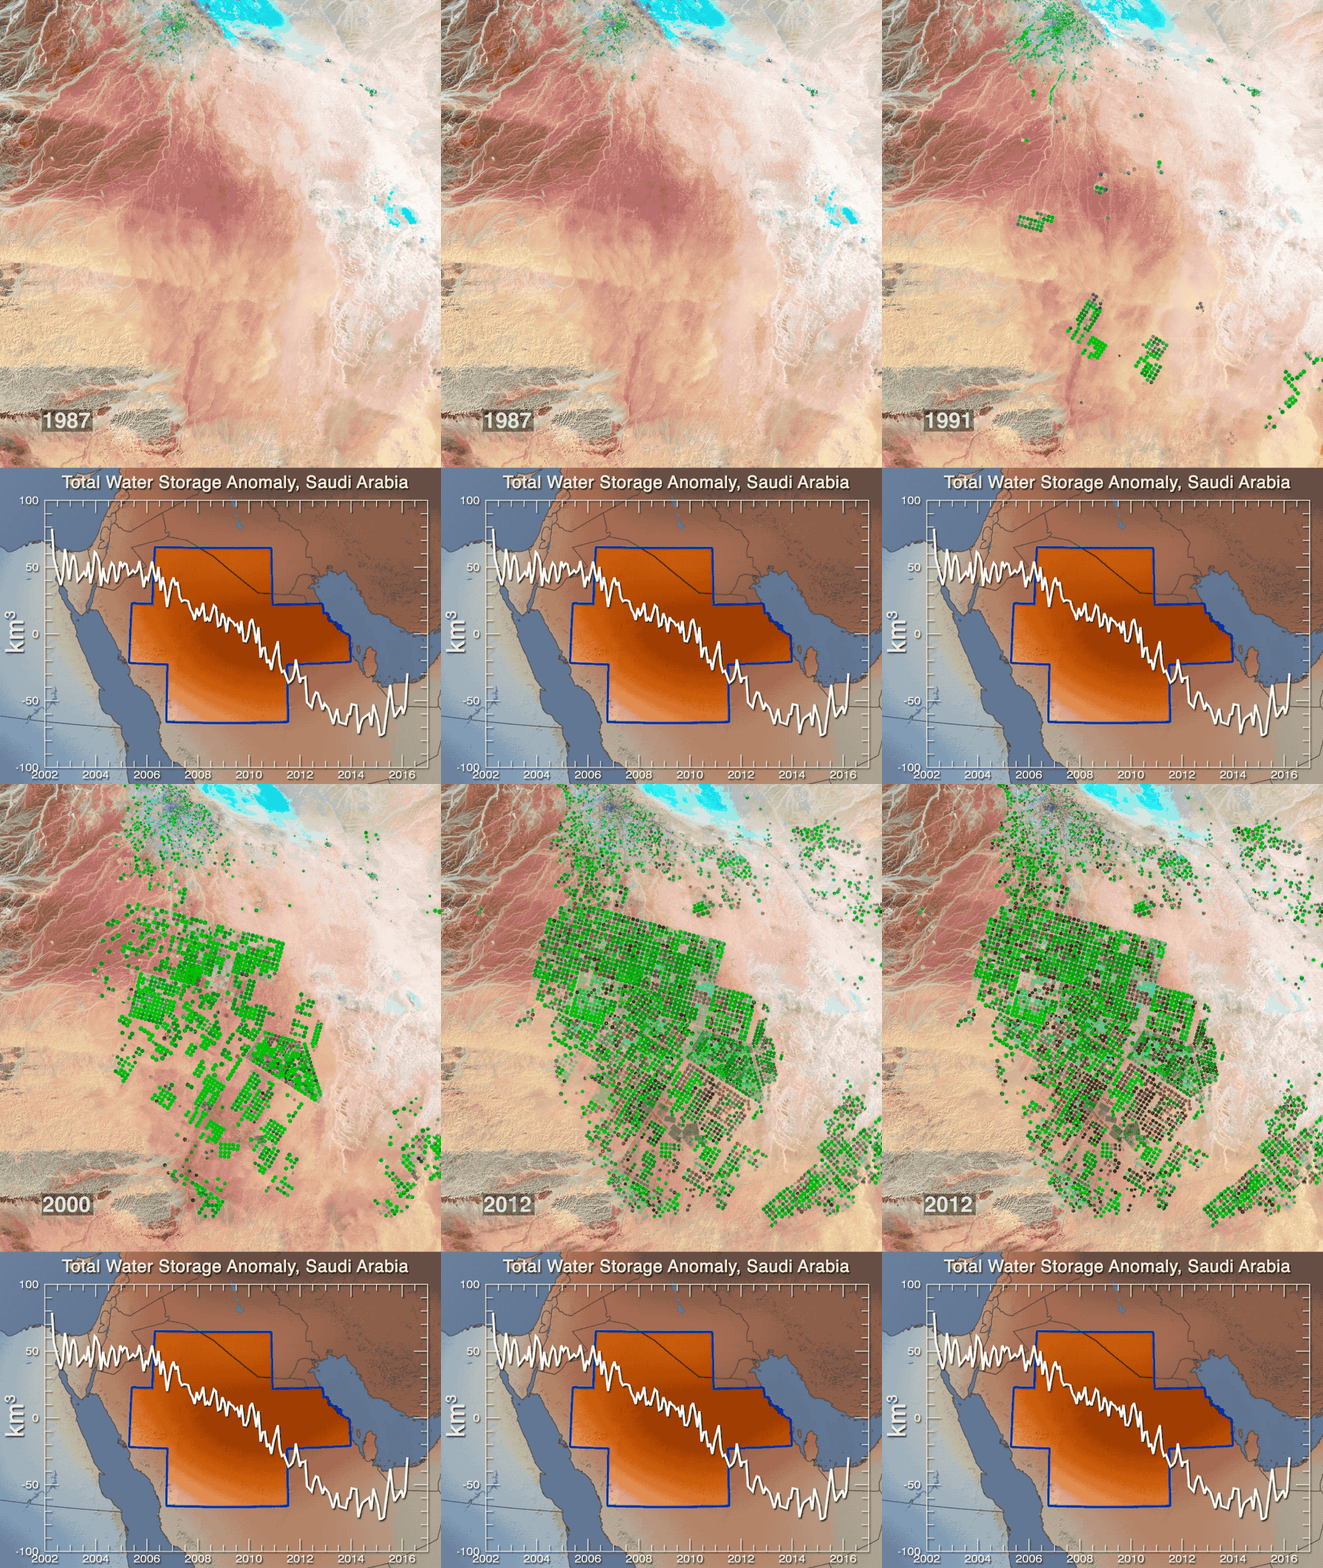
NASA satellites monitoring Earth’s gravity field have given scientists insight into the movement of large masses such as ice and water – including water hidden underground. This global look at changes to the amount of water storied in aquifers, massive underground freshwater reservoirs, has revealed some concerning trends. Of the 37 largest aquifers on Earth, a third of them are being depleted by communities pumping the water faster than it recharges from rainfall. These water declines occur primarily where agriculture and aquifers coincide, and where human water demands can easily exacerbate conditions of periodic drought. Among those most stressed in the past decade are the Central Valley of California, the Indus Basin in northwestern India and Pakistan, and the Arabian Aquifer System in Saudi Arabia.
About 70% of all freshwater on Earth is used for irrigated agriculture. Underground aquifers are water sources that act like waiting bank savings accounts, providing a dependable supply and making agriculture possible in arid areas where significant rain events may only occur once a year and during droughts when surface water is scarce. We do not know the full extent of these underground water aquifers or when they may run dry, but understanding the change in available water that occurs both seasonally and throughout the satellite record helps decision-makers manage their resources.
In addition to witnessing the effects of agriculture, the satellite data show the effects of climate change, most notably in the decline of sea ice and ice sheets at the poles. They also observe the ups and downs of more natural variability that reflects a region’s span of wet or dry years. As the global satellite record extends into the future, researchers and water managers will continue to monitor freshwater hidden below as climate patterns shift and human demands grow.
Download these data visualizations.
V


