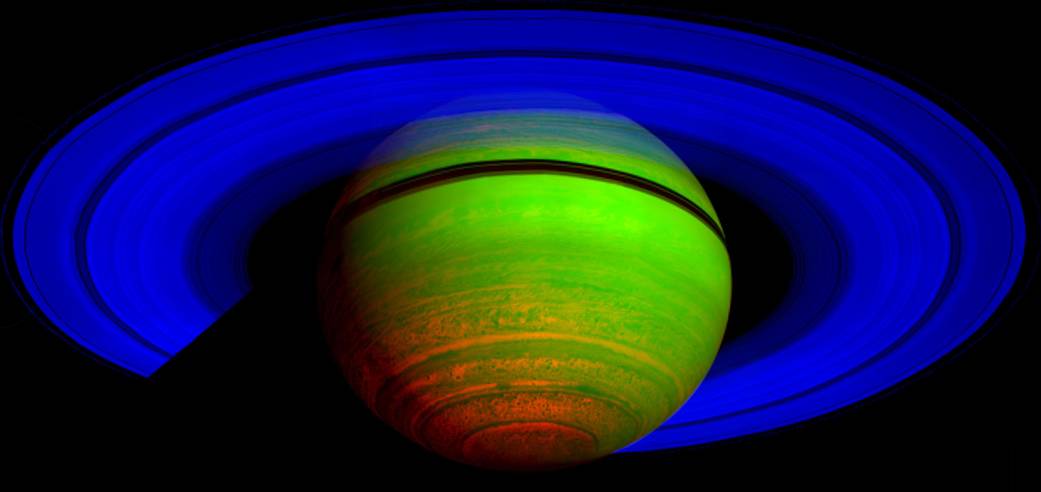
This false-color composite image, constructed from data obtained by NASA’s Cassini spacecraft, shows Saturn’s rings and southern hemisphere. The composite image was made from 65 individual observations by Cassini’s visual and infrared mapping spectrometer in the near-infrared portion of the light spectrum on Nov. 1, 2008. The observations were each six minutes long.
In this image constructed from data collected in the near-infrared wavelengths of light, scientists designated blue to indicate sunlight reflected at a wavelength of 2 microns, green to indicate sunlight reflected at 3 microns and red to indicate thermal emission at 5 microns. Saturn’s rings reflect sunlight at 2 microns, but not at 3 and 5 microns, so they appear deep blue. Saturn’s high altitude haze reflects sunlight at both 2 and 3 microns, but not at 5 microns, and so it appears green to blue-green. The heat emission from the interior of Saturn is only seen at 5 microns wavelength in the spectrometer data, and thus appears red. The dark spots and banded features in the image are clouds and small storms that outline the deeper weather systems and circulation patterns of the planet. They are illuminated from underneath by Saturn’s thermal emission, and thus appear in silhouette.
The Cassini-Huygens mission is a cooperative project of NASA, the European Space Agency and the Italian Space Agency. The Jet Propulsion Laboratory, a division of the California Institute of Technology in Pasadena, manages the mission for NASA’s Science Mission Directorate, Washington, D.C. The Cassini orbiter was designed, developed and assembled at JPL. The visual and infrared mapping spectrometer team is based at the University of Arizona, Tucson.
For more information about the Cassini-Huygens mission visit http://saturn.jpl.nasa.gov. The visual and infrared mapping spectrometer team homepage is at http://wwwvims.lpl.arizona.edu .
Credit: NASA/JPL/University of Arizona

