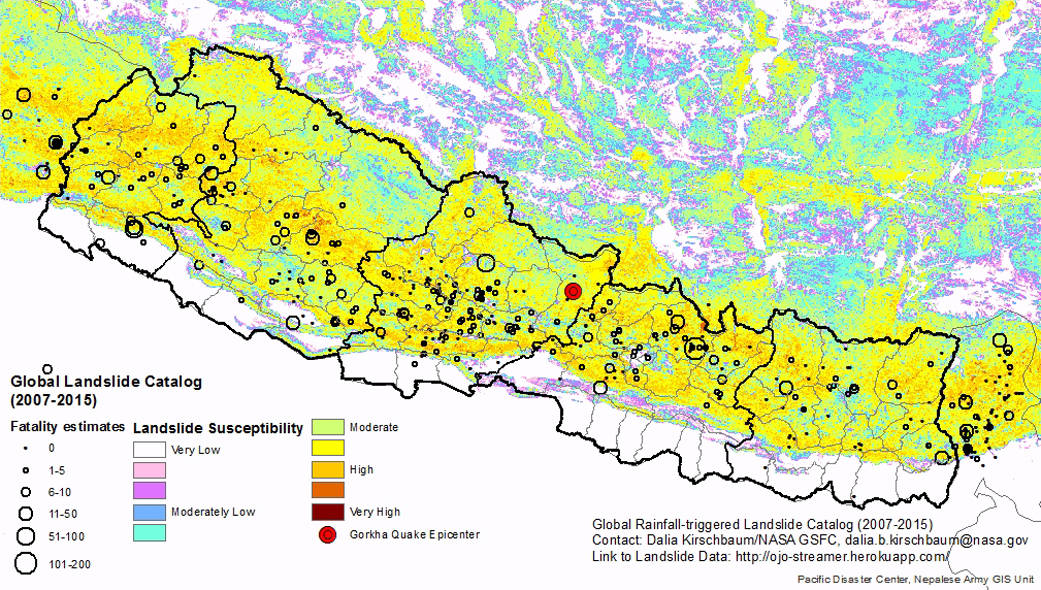
This preliminary map shows regional landslide susceptibility in Nepal. The colors represent the relative susceptibility, from lowest (white) to highest (red). The map was created from four sources: roads are from OpenStreetMap, faults and bedrock types are from the Geologic Map of the World (3rd Edition), forest loss is from the University of Maryland’s Global Forest Change study, and maximum slope values are from the Global Slope Dataset produced by the United States Geological Survey. The landslide susceptibility map shows the possibility of a landslide occurring within each 0.6 square mile (1 square kilometer) pixel within the region, and is calculated using a methodology that combines relevant variables using a set of defined weights. The map can be used to provide situational awareness of areas potentially susceptible to landslides across the country and region. The map does not identify ice and snow avalanche susceptibility.
The landslide points are from a Global Landslide Catalog (GLC) developed to identify rainfall-triggered landslide events around the world, regardless of size, impacts or location. The GLC considers all types of mass movements triggered by rainfall that have been reported in the media, disaster databases, scientific reports and other sources. The size of the circular markers on the map indicates the number of reported fatalities for each event. The map shows events in Nepal from January 2007 to April 1 2015. The GLC has been compiled since 2007 at NASA’s Goddard Space Flight Center in Greenbelt, Maryland, and is freely available at: http://ojo-streamer.herokuapp.com/.
Image Credit: NASA GSFC/USRA


