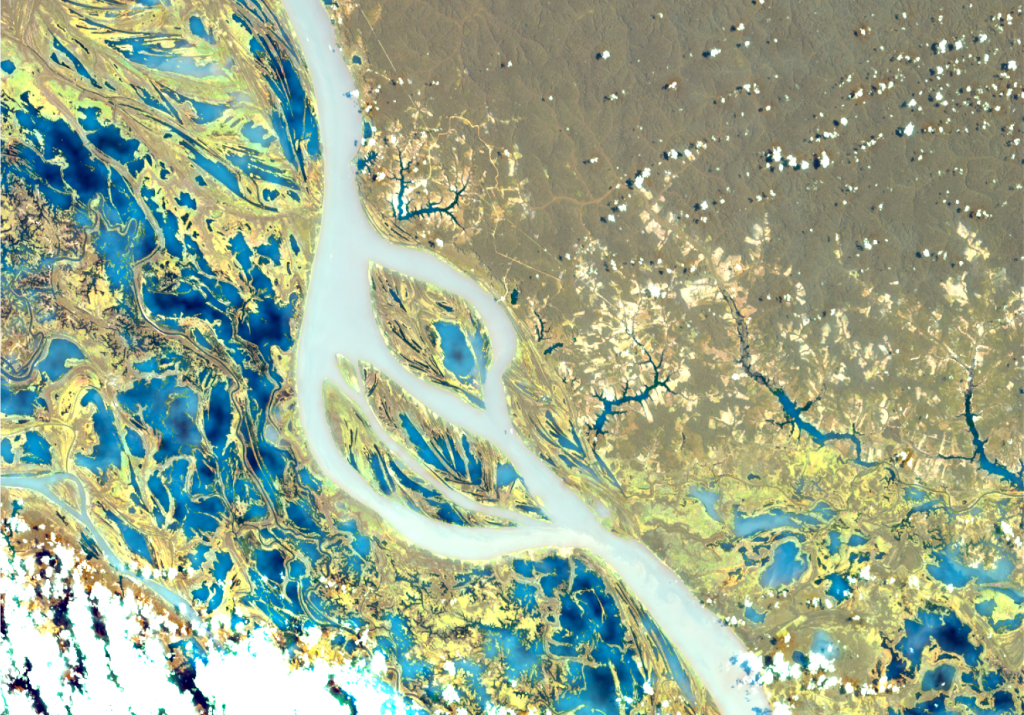
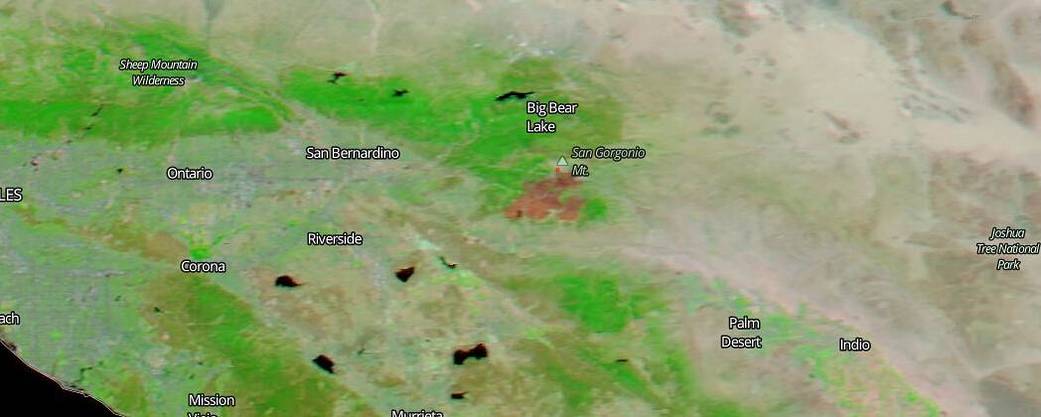
On Aug. 9, 2020 NASA’s Aqua satellite imaged the Apple Fire near Big Bear Lake in California using its false-color bands in order to be able to distinguish burn scars from the surrounding area more easily. The combination of reflectance bands 7, 2, and 1 on the MODIS instrument are most useful for distinguishing burn scars from naturally low vegetation or bare soil and enhancing floods. The MODIS Corrected Reflectance imagery is available only as near real-time imagery. The imagery can be visualized in Worldview and the Global Imagery Browse Service (GIBS). This image was made using the Worldview Data site. Burned areas or fire-affected areas are characterized by deposits of charcoal and ash, removal of vegetation and/or the alteration of vegetation structure. When bare soil becomes exposed, the brightness in Band 1 may increase, but that may be offset by the presence of black carbon residue; the near infrared (Band 2) will become darker, and Band 7 becomes more reflective. When assigned to red in the image, Band 7 will show burn scars as deep or bright red, depending on the type of vegetation burned, the amount of residue, or the completeness of the burn.
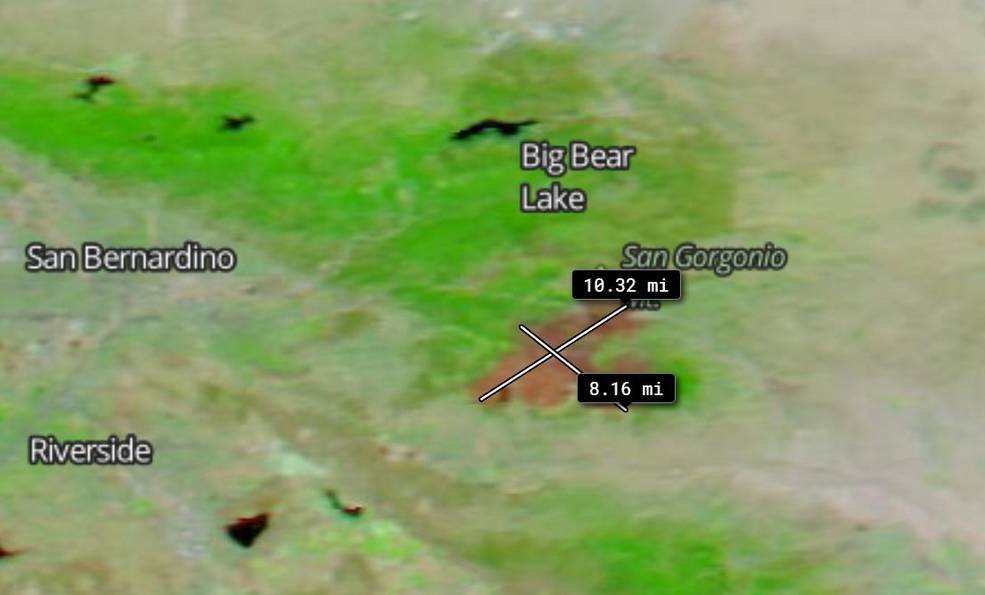
In the image below, the measurement tool on the Worldview app was used to show the size of the burn scar. Using the tool, the scar was measured to be approximately 10.32 miles long and 8.16 miles wide. The Inciweb site is reporting that the Apple Fire is currently 32,905 acres in size and is 45% contained. Significant fire suppression is being provided by fire officials and continued advancement of the containment is the central goal. Fire crews will work on reducing fuel load to further contain the blaze and will also focus on repairing impacts to the landscape from fire suppression efforts. With increased winds forecasted for August 10 firefighters crews will continue to be on the lookout for hotspots and sources of spotting across the fire’s edge.
NASA’s Earth Observing System Data and Information System (EOSDIS) Worldview application provides the capability to interactively browse over 700 global, full-resolution satellite imagery layers and then download the underlying data. Many of the available imagery layers are updated within three hours of observation, essentially showing the entire Earth as it looks “right now.” Actively burning fires, detected by thermal bands, are shown as red points. Image Courtesy: NASA Worldview, Earth Observing System Data and Information System (EOSDIS). Caption: Lynn Jenner with information from Inciweb.

