Fire season has started with a bang in North America. Mexico is experiencing an extremely difficult fire season with 4,425 blazes recorded to date. Firefighters are averaging battling 100 fires per day in brush, scrub, agricultural and forest land throughout the country. Approximately 378,000 acres have burned this season alone. The smoke generated by these fires has been so extreme that a pollution alert was triggered this past week. The rainy season in Mexico does not start until summer and spring is often the time that wildfires burn out of control.
Canada has also been overwhelmed by the outbreak of wildfires. On Monday, May 20, six separate wildfires were burning out of control, and four days later one of those fires has grown to nearly 230,000 acres. Close to 5,000 people have been evacuated to escape the Chuckegg Creek Wildfire, which is burning in Mackenzie County in the northern part of Alberta. This fire has produced huge amounts of smoke, which has also combined with smoke from the other fires burning across the landscape. The weather conditions for the next week are not conducive to firefighting, with no rain forecast for the week and winds gusting to 20 mph.
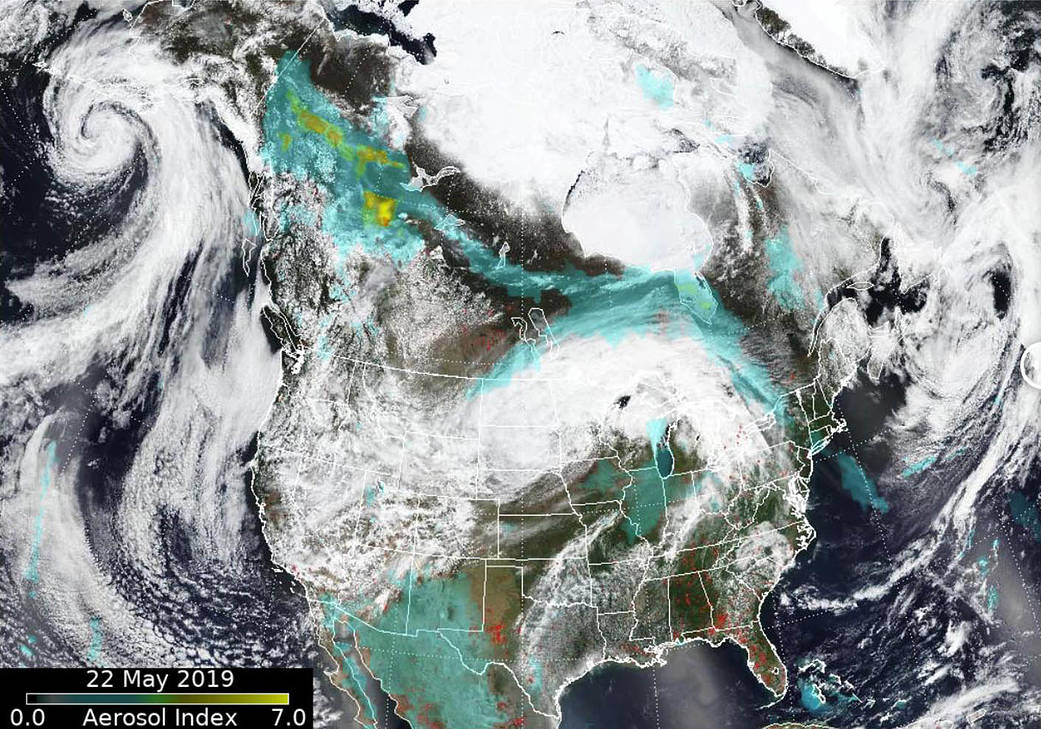
Beyond the catastrophic effects of fires on the ground, smoke can also affect areas far from the originating fires. In particular, the Chuckegg Creek fire produced a pyrocumulonimbus (pyroCb) on May 18th. A pyroCb event combines smoke and fire with the features of a violent thunderstorm, and pollutants and smoke from these storms are funneled into the stratosphere, resulting in plumes that can travel long distances. Dr. Colin Seftor of the Atmospheric Chemistry and Dynamics Laboratory at Goddard reported that smoke from this event combined with smoke from other fires and was steered by the winds from a high pressure system that blew smoke from southeast to northwest (on the left side of the system) and northwest to southeast (on the right side of the system) as the smoke curled around it. The resulting smoke plume stretched thousands of kilometers across Canada. In this image produced by Dr. Seftor, the aerosol is denoted by a quantity known as the aerosol index. Lower values of the index (blue and green) denote less smoke while larger values (yellow) denote more smoke. Dr. Seftor said that data obtained from the CALIPSO sensor indicated the height of the smoke plume on May 21 was around 6 km for the most part, reaching up to 9 km at the southernmost extent of the plume which, at that time, was just below Hudson Bay. By May 22, the prevailing winds continued to carry the plume northwest up to the Alaskan border and southeast across Canada, over New England, and into the Atlantic.
NASA’s Earth Observing System Data and Information System (EOSDIS) Worldview application provides the capability to interactively browse over 700 global, full-resolution satellite imagery layers and then download the underlying data. Many of the available imagery layers are updated within three hours of observation, essentially showing the entire Earth as it looks “right now.” This image used data obtained on May 22, 2019 from both the Ozone Mapping and Profiler Suite (OMPS) sensor and the Visible and Infrared Imaging Sensor (VIIRS) onboard the Suomi NPP satellite. The underlying image was created using the red, green, and blue wavelength measurements from VIIRS. Actively burning fires are detected using the thermal bands from VIIRS and are shown as red points. OMPS data was used to produce the aerosol index. Image Courtesy: NASA Worldview, Earth Observing System Data and Information System (EOSDIS). Caption: Dr. Colin Seftor/Lynn Jenner with information from several news agencies


