
Outgassing and Dust Lofting
from the
Lunar Surface after Descent Engine Shutdown
Copyright © 2007 by the Editors of Working on the
Moon.
Last revised 21 December 2011.
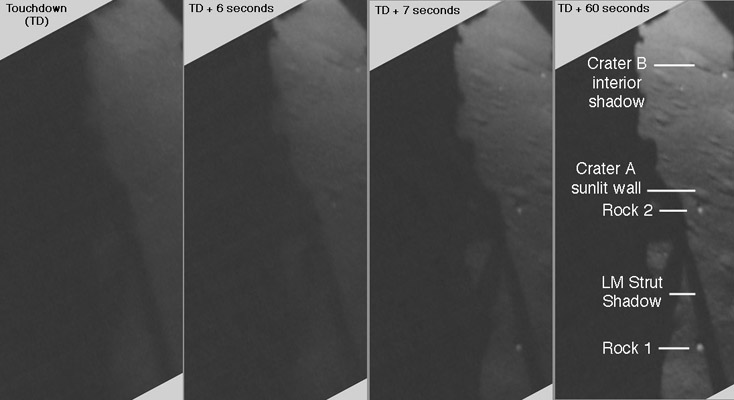
Apollo 17. Portions of four 16-mm frames shot out the LMP's window. At touchdown (left), rocks and small craters are hidden by a layer of lofted dust. By 6 seconds after touchdown (next right), a small crater and adjacent rock near the top of the view are becoming visible. One second later, visibility has improved markedly and two nearer rocks and various small craters are visible. By one minute after touchdown (right), no appreciable obscuration remains.
Summary
During the final descent, the Descent Engine exhaust scours the lunar surface and propels dust particles laterally at high velocities, creating a sheet or veil that obscures the surface. After shutdown, no more particles are accelerated to high speeds and the veil disappears. However, for up to several seconds, the surface close to the LM is obscured by lofted dust. In the Apollo 14 Preliminary Science Report (p89), Mitchell et al. suggest that this may result from penetration of exhaust gases into intergranular spaces in the regolith during the final descent with subsequent outgassing following engine shutdown. The duration and distribution of this lofted dust varied from mission to mission and probably depended on the verticality and descent rate of the final approach, altitude at engine shutdown, and soil porosity and surface topography directly under the LM. On Apollo 11, post-shutdown obscuration lasted about 7 seconds, perhaps because Neil Armstrong didn't get the engine stopped until touchdown or just thereafter. On Apollo 17, the obscuration also lasted for about 7 seconds, perhaps because Gene Cernan brought the LM down very slowly during the 8 seconds prior to engine shutdown. The shortest period of obscuration is seen in the Apollo 16 film. Intermittent obscuration occurs for about 2.2 seconds after shutdown.Lessons
- Obscuration of the surface can continue for a few seconds
after
engine shutdown.
- The occurence of dust lofting after engine shutdown
suggests that
the permeability of lunar soil should be taken into account
when
considering for some applications at a future lunar
facility.
- The window-mounted camera proved to be a versatile tool
for
diagnostics, mapping, and scientific observation and, as
demonstrated
by the Mars Rovers, multiple viewpoints can be of
considerable value.
Obscuration as seen in 16mm films shot during the landings
Examination of the landing films shows that, with the exception of Apollo 11, engine shutdown is marked by sudden downward motion of features in the LM shadow. The moment of touchdown is equally evident. The duration of obscuration is necessarily subjective, particularly in the case of Apollo 11. On that mission, the LM was rotated (yawed) 13 degrees left when it landed. Consequently, from touchdown onward, the field-of-view of the 16-mm camera in the LMP's window is filled with the LM shadow, except for one corner. The moment when our view of the surface clears is quite evident, but the moment of touchdown can only be roughly estimated. In the Apollo 14 film, what we describe as "strong streaks" are quite dynamic and suggest jetting.
| Mission |
Touchdown (GET) |
Shutdown (SD) (sec before TD) |
Visibility improves (sec after SD) |
| Apollo 11 |
102:45:40 | probably after TD |
7 (16mm) |
| Apollo 12 |
110:32:36 |
1.3 |
4? (16mm) scene darkens at about TD |
| Apollo 14 |
108:15:09 |
0.2 |
0.8 (16mm); strong
streaks persist for 8 seconds. Oddball |
| Apollo 15 |
104:42:29 |
2.7 (16mm) |
6 (16mm) |
| Apollo 16 |
104:29:35 |
0.7 (16mm) |
2.2 (16mm) |
| Apollo 17 |
110:21:58 |
0.5 (16mm) |
7.5 (16mm); slow descent for 8 sec before shutdown |
Analysis of the Apollo 17 Film
We have made screen grabs from the copy of the landing film included in the Spacecraft Films Apollo 17 DVDs. We did grabs at one second intervals from Touchdown (TD) to TD + 14 sec, plus grabs at 30 and 60 seconds. Each frame was rotated 28.1 degrees - as can be seen in the partial frames above - so that a vertical line could be drawn through the two rocks and two craters labeled above. Each frame was converted to greyscale and was enhanced in Photoshop Elements 3.0 by using information between levels 50 to 160 in the original as input and converting it to the full range of 0 to 255 for output.A thin strip, with dimensions 5 by 614 pixels, was them cut from each frame. The strips have precisely the same location in their respective frames and include the two rocks and two craters. The bottom 5 x 20 pixels in each strip were converted to white (Level 0) and the top 5 x 20 pixels were converted to black (Level 255). A comparison of selected strips is presented below. An unenhanced (UN) version of the 60 second strip is included on the right.
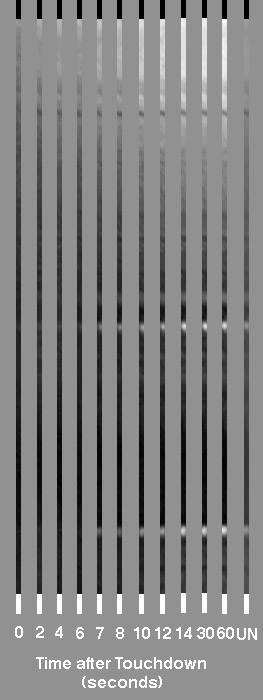
In the bottom half of this comparison, the two rocks and the sunlit wall of Crater A (see the figure at the top of the page) become visible at TD + 7 seconds. Crater B's interior shadow is faintly visible at Touchdown and is clearly visible by TD + 2 seconds. The strip labeled "UN" on the righthand side is an unenhanced version of the 60 seconds strip.
Software program NIH Image was then used to create an
image-density
profile for each strip. After loading a strip into NIH
Image, the
entire strip was selected so that the profile represents the
average
density for the five
pixels at each position along a strip.. Comparisons of
selected
profiles are presented next;
objects farthest from the LM are on the left and those closest
are on
the right.
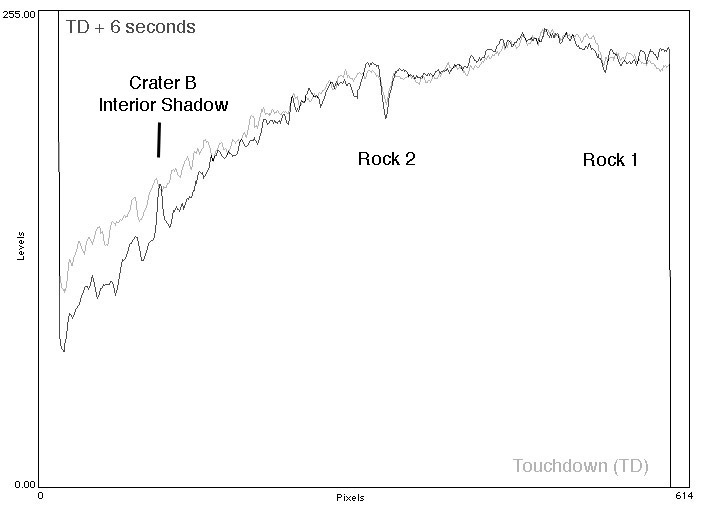
Comparison of the density profile at Touchdown (fainter profile) with the profile at TD + 6 seconds (darker profile), which is just before the rocks become easily visible. Objects closer to the LM are on the right. White (Level 0) is at the bottom and Black (Level 255) is at the top. Note the general brightening and increasing contrast on the left.
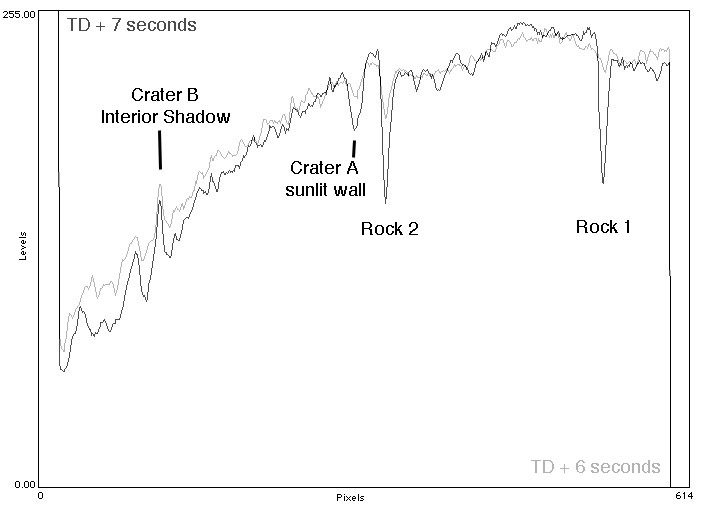
Comparison of the density profile at TD + 6 seconds (fainter profile) and TD + 7 (darker profile), showing a significant increase in visibility near the LM between these two frames. Objects near the LM are on the right; more distant objects are on the left. White (Level 0) is at the bottom and Black (Level 255) is at the top.
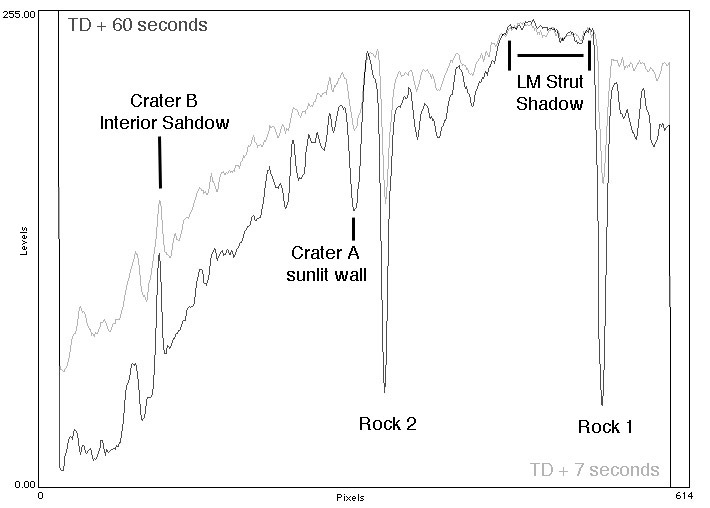
Comparison of the image-density profile at TD + 7 seconds (fainter profile), which is the first time that the two rocks are easily seen in the film, with the profile at TD + 60 seconds (darker profile), by which time obscuration by the lofted dust has fully dissipated. Objects nearest the LM are on the right.
The next plot shows
image-density
histories for the two rocks. Up to TD+6, both rocks
are heavily
obscured and the image density is indicative of the layer of
lofted
dust. As can be seen in the frames at
the top of this page, the scene is generally brighter at the
top than
at the bottom, probably because of phase angle (angle from
the
direction exactly opposite the Sun). The lunar surface is
brightest in
the direction directly opposite the Sun - called
down-Sun. For an
observer looking out the LMP's window, down-Sun would
correspond to the
upper parts of the LM shadow, which is out of the 16mm frame
at the top
and to the left. (See a pre-EVA-1
pan
taken out the windows and assembled by Dave Byrne.)
Consequently,
the location of Rock 1, which is closer to the LM, is darker
than the
location of Rock 2, which is farther from the LM. Once
the two
rocks become visible, their image-densities are quite
similar.
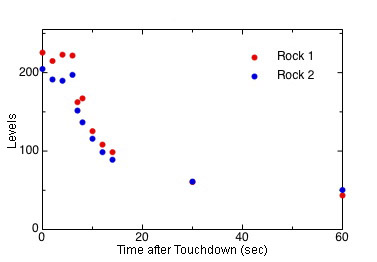
Brightness (levels) at the locations of Rocks 1 (red) and 2 (blue) after Touchdown.
White (Level 0) is at the bottom and Black (Level 255) is at the top.
Rock 2 is farther from the LM. Note that the levels at 30 seconds
are virtually identical.
The next plot shows
image-density
histories at the locations of the sunlit Crater A wall and
the Crater B
interior shadow. As discussed above,
the surface near Crater B will be brighter than the surface
near Crater
A because of phase angle. In fact, variations in
brightness with
phase angle are great enough that the shadow inside
Crater B is
brighter than the sunlit
wall in Crater A.
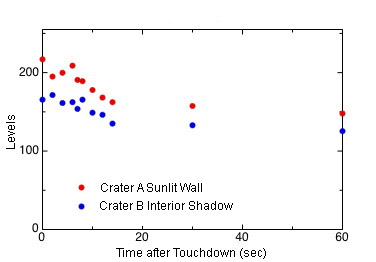
Brightness (levels) of the sunlit wall of Crater A (red) and the interior shadow of Crater B (blue). White (Level 0) is at the bottom and Black (Level 255) is at the top.
Discussion of Outgassing after Descent Engine
Shutdown
Apollo 11
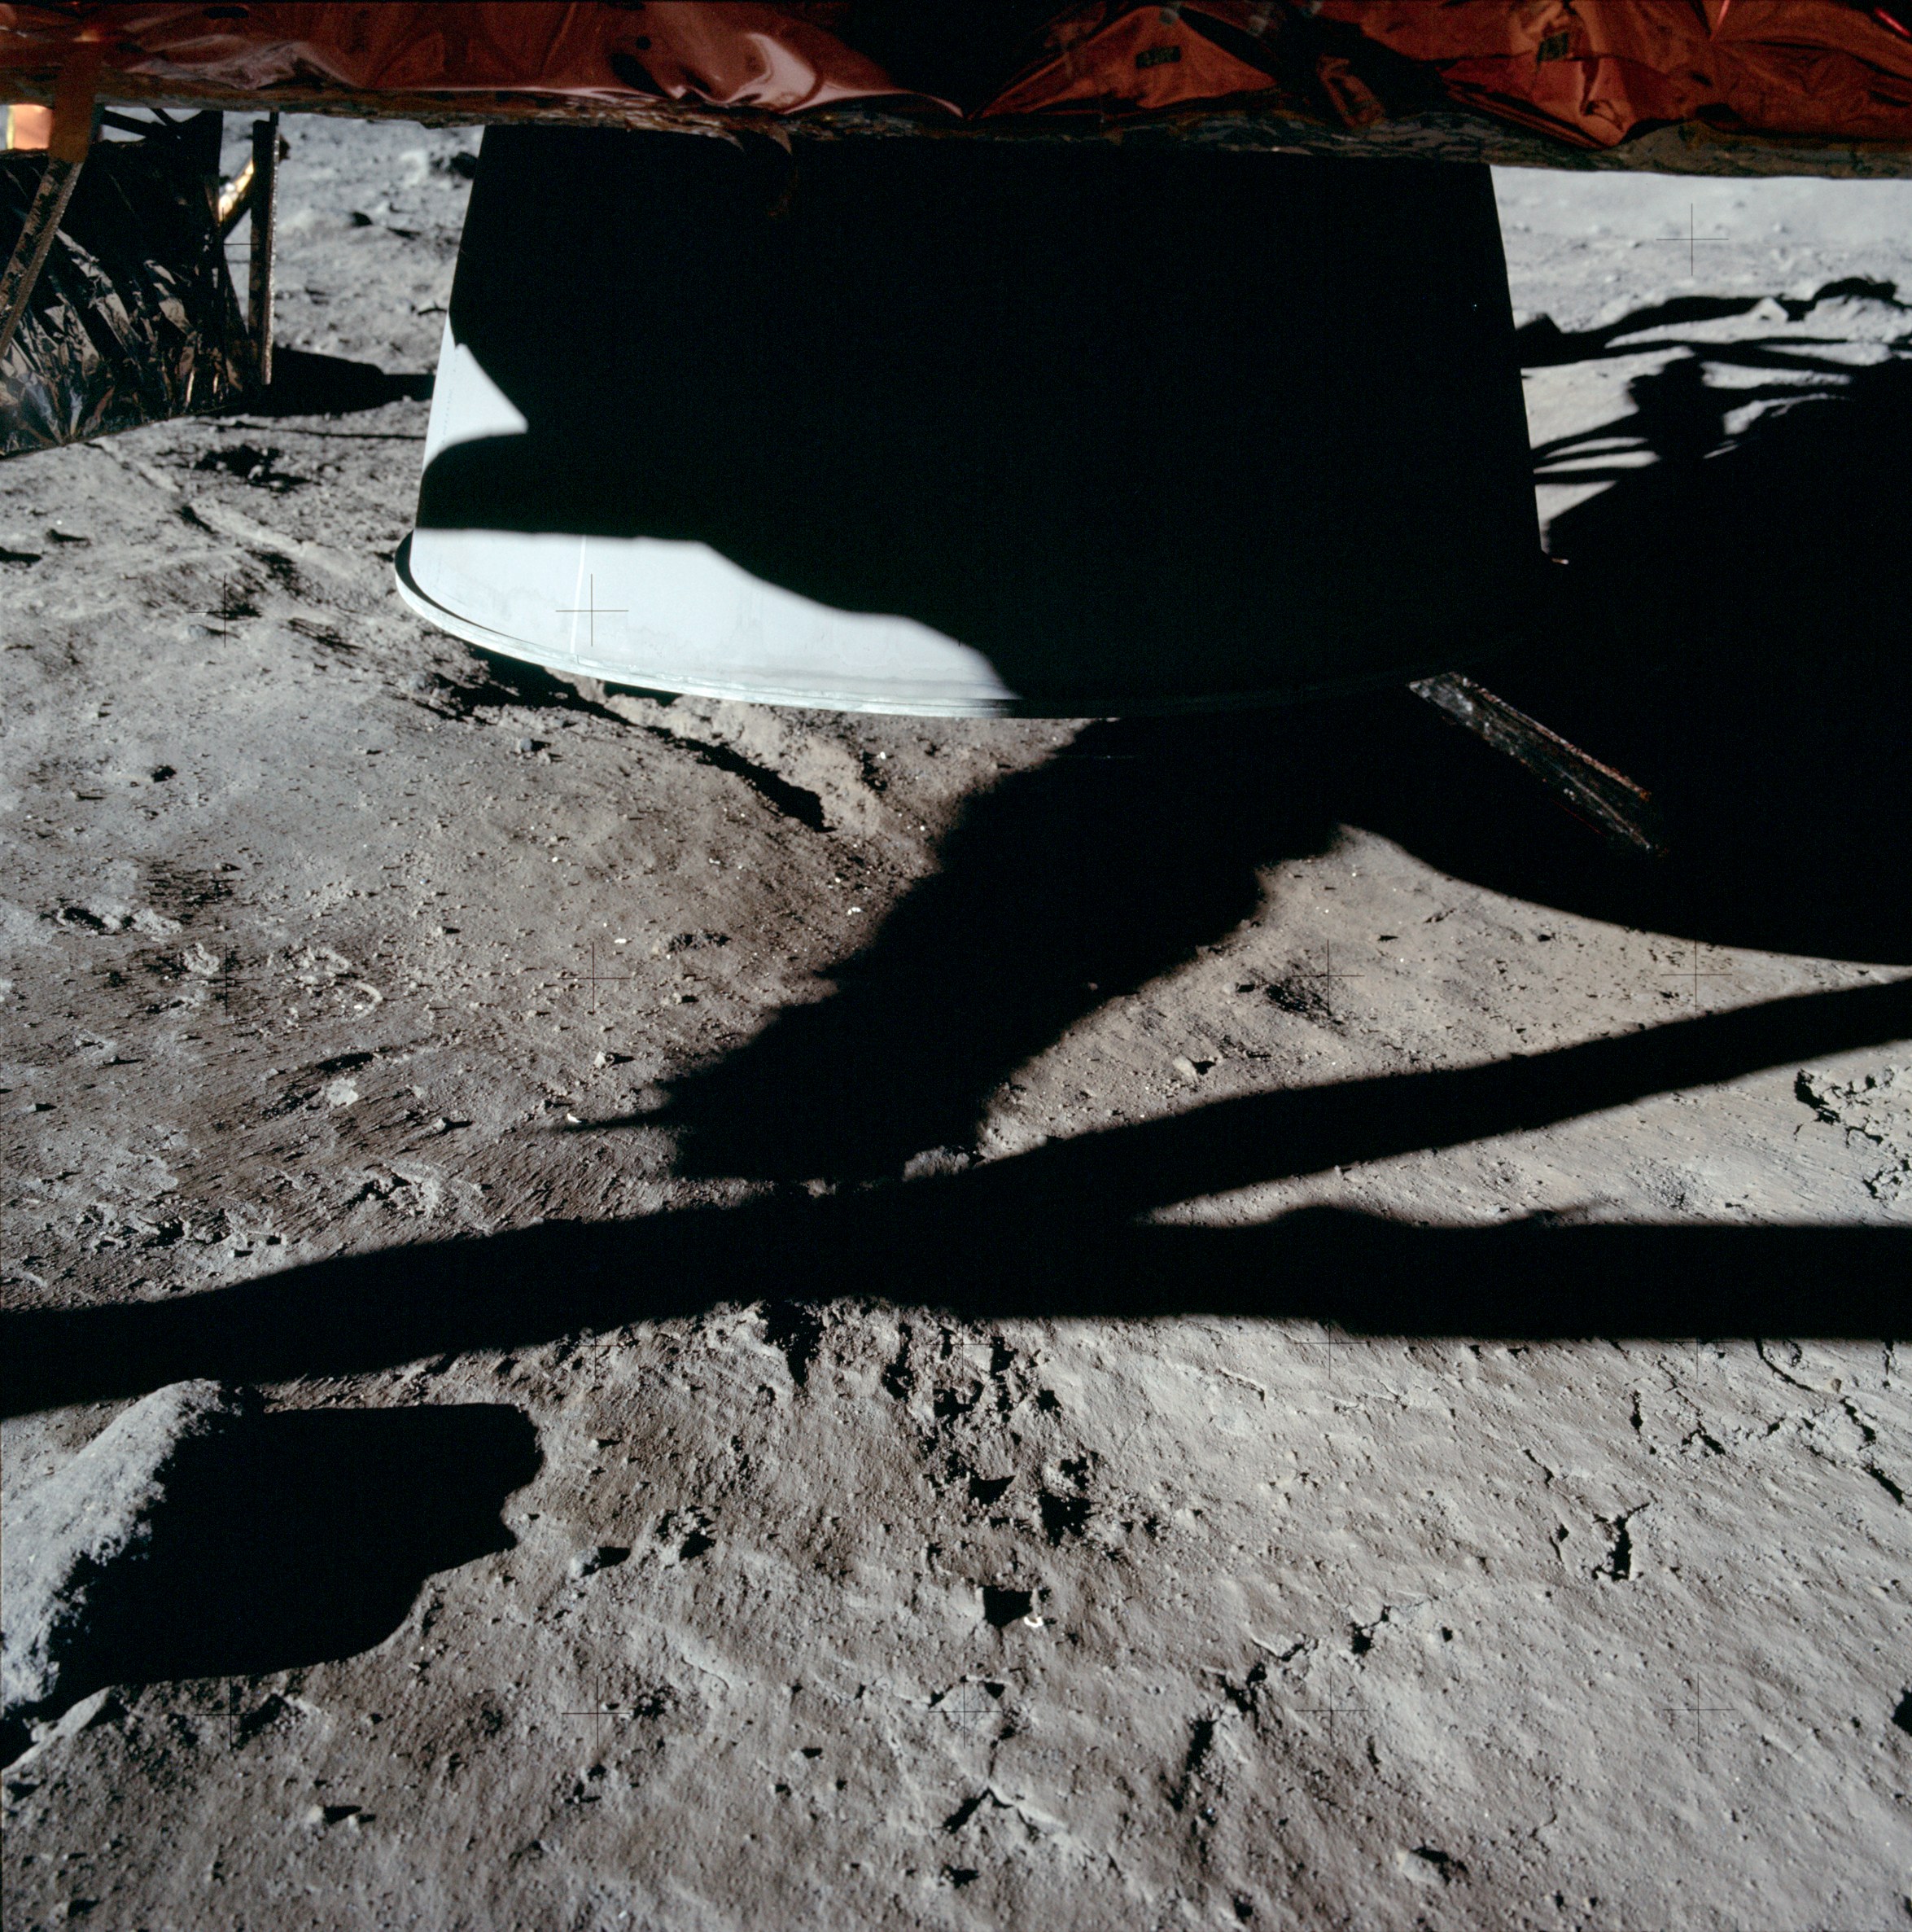
(1) Preliminary Science Report, Crew Observations, page 37: "The soil under the LM showed no evidence of disruptive outgassing of injected engine gases."
(2) Preliminary Science Report, Soil Mechanics Investigation, page 85: "By considering the lunar soil to be a medium that is permeable to gas flow and has a permeability in the range appropriate for the grain size of the lunar soil model material and by ignoring the erosion mechanism, Scott and Ko (Scott, R.F. and Ko, H.Y., Transient Rocket-Engine Gas Flow in Soil. AIAA, vol. 6, No. 2, Feb. 1968) examined the mechanies of compressible gas flow through the soil medium under lunar surface conditions. On analysis of the Surveyor test results and of postflight tests, scaled to the LM, Scott and Ko found that a vertical descent (or steady engine firing in one position) followed by a rapid shutdown of the engine could give rise to gas pressures inside the soil that would exceed the lunar weight of the soil overburden. Thus, shutdown could be followed by a venting of the gas through the surface soil, accompanied by upward ejection of the surface soil. The extent and amount of soil removed by such explosive outgassing depend, for any given soil and engine, considerably upon the flightpath and the engine shutdown pressure transients. A slow vertical descent and a rapid decay at shutdown would produce the largest quantity of ejected soil material."
(3) Preliminary Science Report, Soil Mechanics Investigation, Quotation 11, pages 97: Armstrong (at 110:46:36 GET) : "There's no evidence of (any) problem underneath the LM due to engine exhaust or drainage of any kind."
(4) Preliminary Science Report, Soil Mechanics Investigation, pages 98-100: "Quotation 11 indicates that the astronauts did not observe any gas-venting effects during EVA, and Astronaut Aldrin made the following comment :
(Quotation 15) 'It was reported beforehand that we would probably see an outgassing from the surface after actual engine shutdown, but, as I recall, I was unable to verify that.'""However, in an examination of the sequence-camera film, although there is difficulty in correlating events on the film with spacecraft events, such as engine shutdown, a change in the erosion pattern appears to occur at approximately the same time as engine shutdown. Figures 4-17(a) and 4-17(b), from the last few frames in the film, show this transient effect, which may be caused by either a change in the engine behavior or by an outgassing effect. In figure 4-15 (in the lower right corner and in the bottom of the photograph), numerous fractures appear in the lunar surface in the region that was disturbed by DPS engine exhaust. Because the firing of a rocket engine against a slightly cohesive soil in a vacuum results in a 'plucking' type of erosion in which soil chunks are plucked out of the surface and ejected, these fractures could be of this type of plucking erosion. In addition, venting of the exhaust gases from the soil surface after engine shutdown also causes removal of the soil in chunks or lumps when the soil is cohesive; therefore, the cracks may be evidence of venting."

Apollo 14
Apollo 14 Preliminary Science Report, page 89: "In the Apollo 14 descent motion pictures, it is evident that the lunar surface remains indistinct for a number of seconds after descent-engine shutdown. This event was probably caused by venting from the soil of the exhaust gas stored in the voids of the lunar material during the final stages of descent. The outflowing gas carries with it fine soil particles that obscure the surface."
Apollo 15
Apollo 15 Preliminary Science Report, pages 25-52 and 25-53: "Therefore, it is speculated that the bright halo surrounding the LM is caused by the compaction of the lunar soil under the influence of the dynamic pressure of the descent-engine exhaust gases. Preliminary calculations indicate that such pressures approach the 6.89 X 10³ N/m2 level, quite sufficient to decrease the porosity of the photometric layer greatly. This porosity may initially be as high as 80 to 90 percent, according to Hapke's model (ref. 25-18). Quantitative calculations on the actual differences in lunar brightness and gas pressures remain to be performed. Porosities of 40 percent (which correspond to bulk soil densities of 1.8 g/cm3 [ref. 25-19] and would not be changed much by the dynamic gas pressure) do not apply to the photometric layer."
Editors' Note: Porosities as high as 80 or 90 percent are believed to exist only in the top millimeter or two of the lunar soil.
Ref. 25-18. Hapke, Bruce W.: A Theoretical Photometric Function for the Lunar Surface. J. Geophys. Res.,vol. 68, no.15, Aug. 1, 1963, pp. 4571-4586
Ref. 25-19. Birkebak, R.C.; Cremers, C.J.; and Dawson, J.P.: Spectral Directional Reflectance of Lunar Fines as Function of Bulk Density. Proceedings of the Second Lunar Science Conference, vol. 3, A.A. Levinson, ed., MIT Press (Cambridge, Mass.), 1971, pp. 2197-2202.
Return to Table of Contents