When modeling the El Niño-Southern Oscillation (ENSO) ocean-climate cycle, adding satellite sea surface salinity — or saltiness — data significantly improves model accuracy, according to a new NASA study.
ENSO is an irregular cycle of warm and cold climate events called El Niño and La Niña. In normal years, strong easterly trade winds blow from the Americas toward southeast Asia, but in an El Niño year, those winds are reduced and sometimes even reversed. Warm water that was “piled up” in the western Pacific flows back toward the Americas, changing atmospheric pressure and moisture to produce droughts in Asia and more frequent storms and floods in the Americas. The reverse pattern is called a La Niña, in which the ocean in the eastern Pacific is cooler than normal.
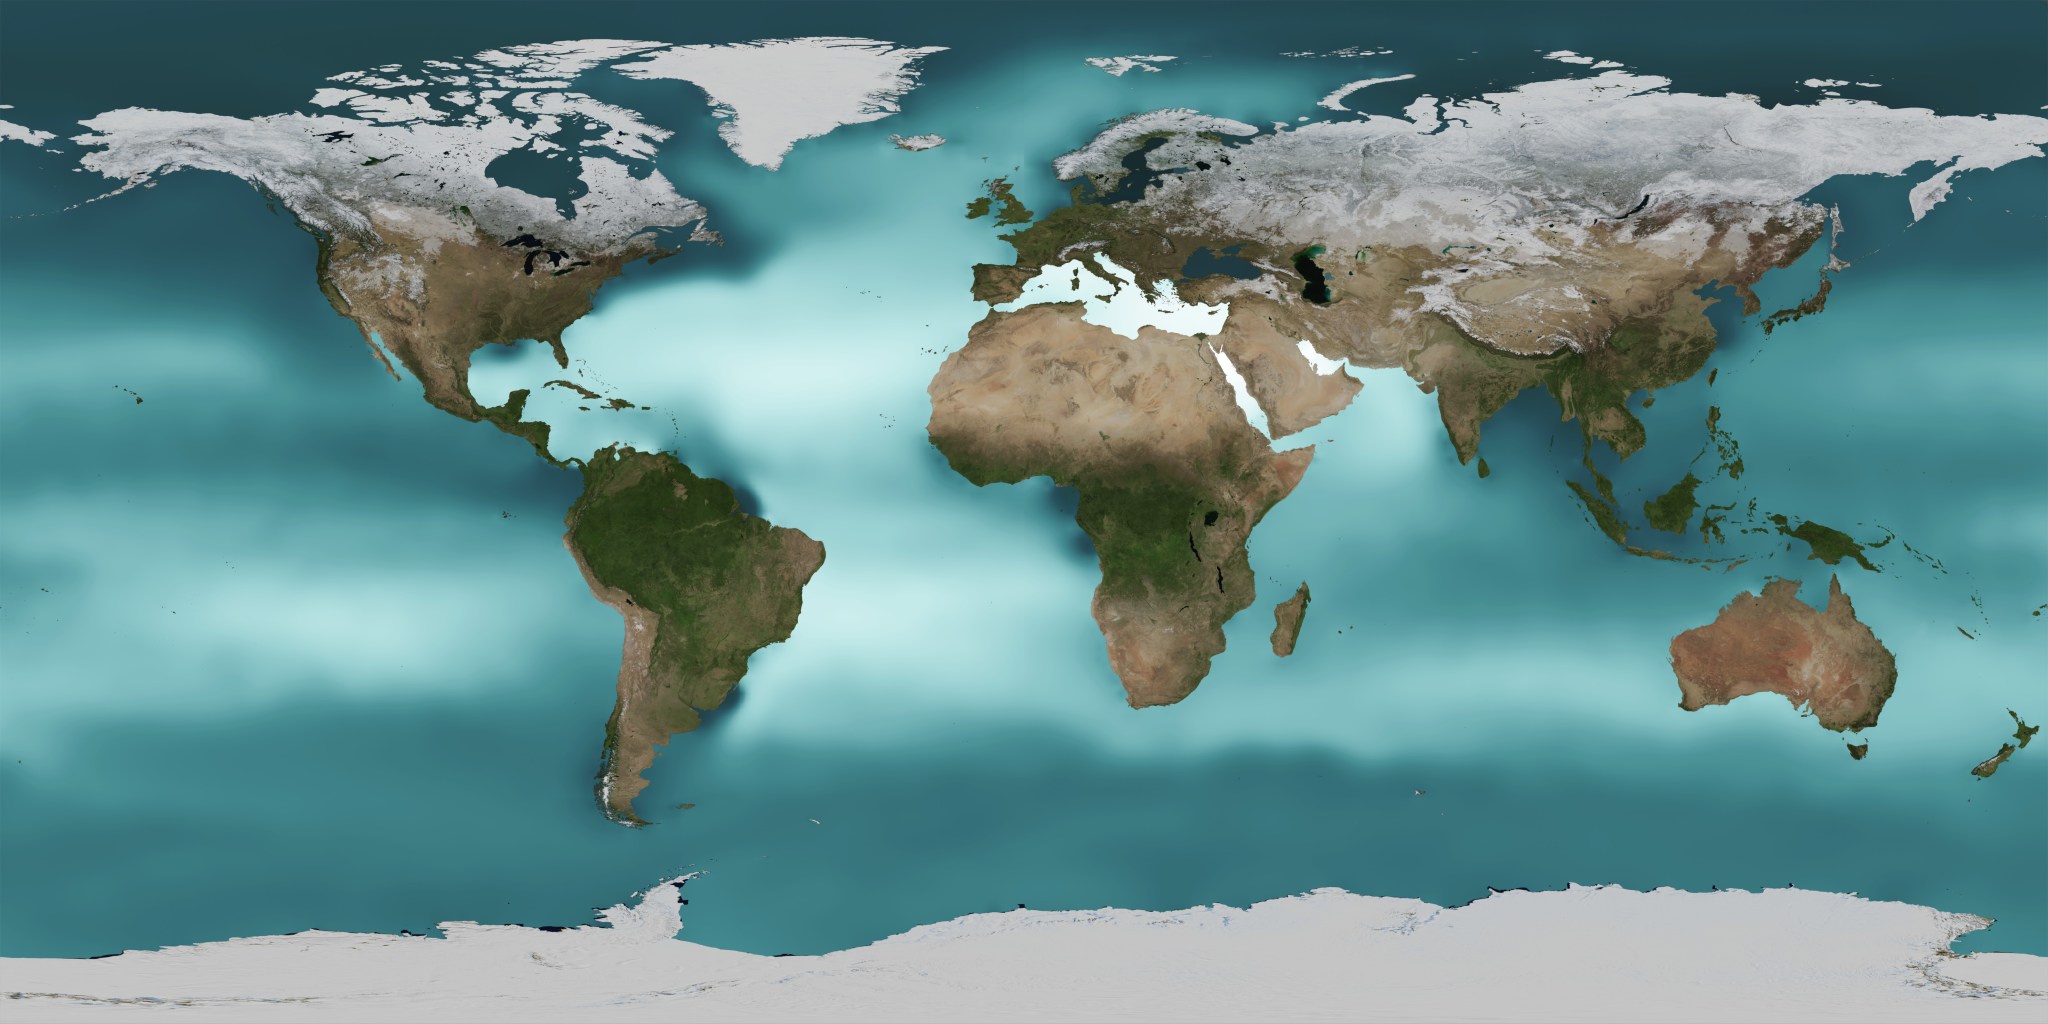
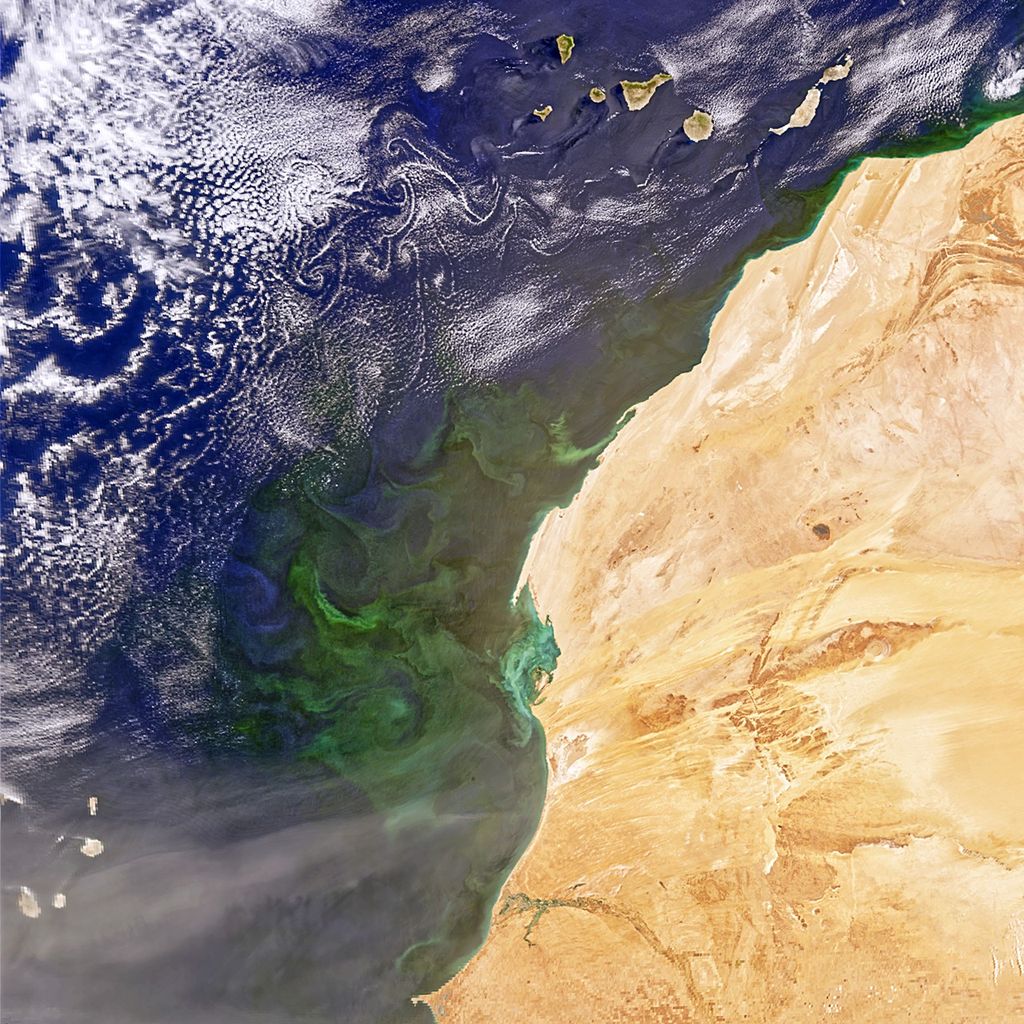
Credits: NASA / Earth Observatory
The team used NASA’s Global Modelling and Assimilation Office (GMAO) Sub-seasonal-To-Seasonal (S2S) coupled ocean/atmosphere forecasting system (GEOS-S2S-2) to model three past ENSO events: The strong 2015 El Niño, the 2017 La Niña and the weak 2018 El Niño.
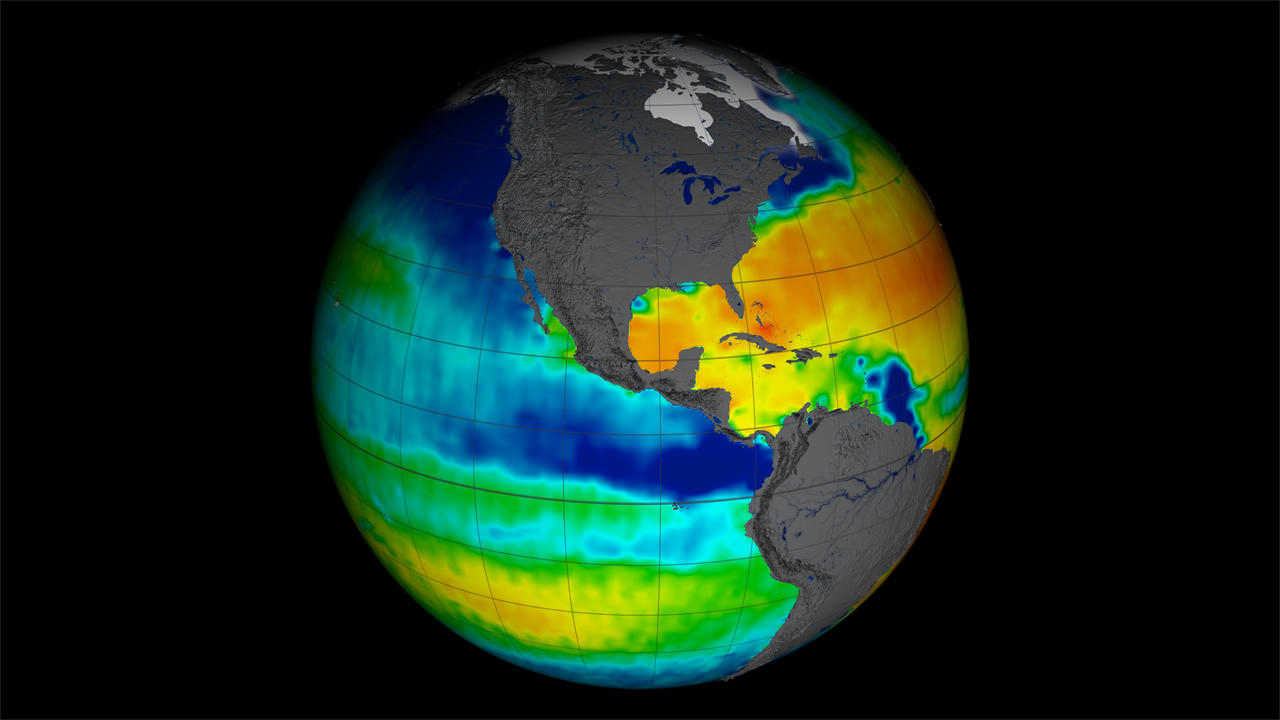
Pulling from NASA’s Soil Moisture Active Passive (SMAP) mission, the past NASA-CONAE (Argentinian Space Agency) Aquarius mission and the European Space Agency’s Soil Moisture Ocean Salinity (SMOS) mission, they compared the forecast model’s accuracy for each of the three events with and without assimilating SSS (sea surface salinity) data into the models’ initialization. In other words: One model run’s initial conditions included SSS data, and the other did not.
Adding assimilation of SSS data to the GEOS model helped it to depict the depth and density of the ocean’s top layer more accurately, which led to better representations of large-scale circulation in response to ENSO. As a result, the models’ predictions for the three case studies more closely reflected actual observations, compared to what forecasting models predicted at the time.
“In our three case studies, we examined different phases of ENSO,” said Eric Hackert, a research scientist at NASA’s Goddard Space Flight Center in Greenbelt, Maryland and the study’s lead author. “For the big El Niño in 2015, assimilating the salinity data damped the signal — our original model was overestimating the amplitude of the event. For the other two ENSO events, the forecasts originally predicted the wrong sign: For example, in 2017, the model without salinity data forecasted an El Niño, while the real ocean produced a La Niña. However, for each case we examined, adding satellite salinity to the initialization improved the forecasts.”
The study is one of the first to incorporate SSS data into forecast initialization for a global coupled model of interactions between the ocean, atmosphere, land, aerosols and sea ice. GEOS and other models used to help predict ENSO events do not typically include SSS. However, ocean surface salinity plays an important role in ocean currents, evaporation and interaction with the atmosphere, and heat transfer from the tropics to the poles. Colder, saltier water is denser and heavier than warmer, fresher water, and the large-scale temperature and precipitation shifts of ENSO events change ocean circulation and interactions between the water and atmosphere.
Both phases of the ENSO cycle affect ecosystems, economies, human health, and wildfire risk — making ENSO forecasts vital for many people around the world, Hackert said.
“For example, forecasts and observations gave a strong indication that there would be a big El Niño in 1997, which would lead to drought in northeast Brazil,” he said. “This allowed the government of Brazil to issue a statement to substistence farmers, encouraging them to plant drought-resistant corn instead of high-yield varieties. In this case, good ENSO forecasts along with government action may have saved many lives. This is just one example of many socio-economic benefits for extending useful El Niño predictions.”
Including satellite SSS data also makes models useful for longer periods — accurate ENSO forecasts without salinity data only extend out 4 months, while those with SSS data cover 7 months, Hackert said.
“Rather than having one season of confidence in your forecast, you have two seasons,” Hackert said. “If your growing season is six months down the line, a longer quality forecast gives you an improved understanding of whether you need to plant high-yield or drought-resistant varieties. Another example would be that you have plenty of time to fix your roof if you live in Southern California (since El Niño typically brings rainy conditions to the southern US).”
Having access to an ongoing record of satellite SSS data is essential for making forecasts accurate and reliable, Hackert said.
“In current forecast systems, satellite and ocean observations are optimally combined using models and data assimilation techniques to help define the state of the ocean,” he said. “This study shows that adding satellite SSS to the suite of current observations helps to characterize the near-surface ocean state, leading to improved seasonal forecasts. We recommend that other forecast model systems around the world adopt SSS into their systems.”
By Jessica Merzdorf
NASA’s Goddard Space Flight Center, Greenbelt, Maryland







/quantum_physics_bose_einstein_condensate.jpg?w=1024)


