As spring and summer temperatures return to the Northern Hemisphere, winter’s snow is melting, releasing precious fresh water into Earth’s streams, rivers and oceans. This annual change provides liquid water for drinking, agriculture and hydropower for more than one billion people around the world. In the future, NASA plans to use a satellite mission to measure how much water the world’s winter snowpack contains, and to do that, they need to know what combination of instruments and techniques will efficiently measure this information from space.
NASA’s SnowEx campaign is a multiyear effort using a variety of techniques to study snow characteristics, and the team completed their second field campaign in March 2020. SnowEx is learning valuable information about how snow properties change by terrain and over time, and they are also investigating the tools, datasets, and techniques NASA will need to sample snow from space.
“This winter’s SnowEx campaign collected valuable data for assessing multiple snow remote sensing techniques. It would not have been possible without the hard work and support of all the participants and partners who helped,” said Carrie Vuyovich, SnowEx 2020 deputy project scientist, lead scientist for NASA’s Terrestrial Hydrology Snow program and a physical scientist at NASA’s Goddard Space Flight Center in Greenbelt, Maryland.
Credits: NASA / Ryan Fitzgibbons
Snow Scientists Dig Deep in Grand Mesa
Coming Together to Measure Snow Water
Snow water equivalent, or SWE (pronounced “swee”), is how much liquid water is in a volume of snow once it melts, and is deduced from depth and density.
“Depths are simple to measure, yet depths often vary greatly from one place to another and that requires a lot of measurements in different places to get a good estimate,” said Chris Hiemstra, a researcher in Fairbanks, Alaska, with the U.S. Army Corps of Engineers’ Cold Regions Research and Engineering Laboratory (CRREL).
“Density is more challenging because it changes with snow age and local conditions. As an example, fresh cold snowfall is light and airy, with only 5-10% water in flakes you can move with a light breath. In warmer snowpack conditions on the ground, cloud-borne snowflakes fuse and change to larger bonded round grains of higher density. With wind, snow is blown, broken and packed into drifts, but even then, it is only 40-50% water. Variability in depths and densities makes SWE challenging to map.”
Wet snow falling at temperatures around freezing (32 degrees) typically has a density of about 8-10 inches of snow equaling 1 inch of SWE. In other words, it would take about 8-10 inches of wet snow at freezing temperatures to get 1 inch of melted water. In contrast, snow that falls at colder temperatures, around -4 degrees, is far less dense: To get 1 inch of melted water from snow in these conditions, you might need up to 20 inches of it.
Current satellite missions easily measure how much of the land is covered by snow. But no single satellite currently in orbit contains an instrument or collection of instruments designed to measure SWE and/or the snow characteristics that may be used to calculate it.
For SnowEx 2020’s intensive operating period, a grueling three weeks of data collection at one site, scientists from around the world traveled to Grand Mesa, Colorado. It is the world’s largest mesa, or flat-topped mountain, and at 11,000 feet above sea level, winters are long and snow can be deep. Its high flat surface and variety of land cover — from wide-open meadows to dense forests — make it perfect for testing instruments across different conditions.
Through biting cold, dazzling sunshine, heavy snowfall and high winds, the ground-based team dug, sampled and refilled more than 150 snow pits: Car-sized holes in the snow that extend all the way to the ground, allowing them to take measurements of the pit walls and see how snow characteristics vary from top to bottom. Other team members used probes to measure nearly 38,000 snow depths during the three weeks while skiing or snowshoeing in an area the size of a football field around the pits.
“We can see, and even hear, how the snow’s characteristics change from top to bottom,” said Hiemstra. “The newest snow at the top is fluffy and quiet. Below that, the wind has packed it into dense layers that scrape on the shovel. The snow toward the bottom is loose and has sharp pointed edges. When you dig into it, icy points snap and ring as they fall against the shovel.”
The pit crews also measured snow water content, temperature, reflectance and particle size. Researchers used hand-held instruments to measure snow hardness, microstructure and depth around the pits. “One challenge with these point observations is the comparison with airborne and spaceborne observations, which have footprints on the order of tens to thousands of meters,” said HP Marshall, an associate professor at Boise State University, Idaho, a researcher with CRREL and SnowEx 2020’s project scientist.
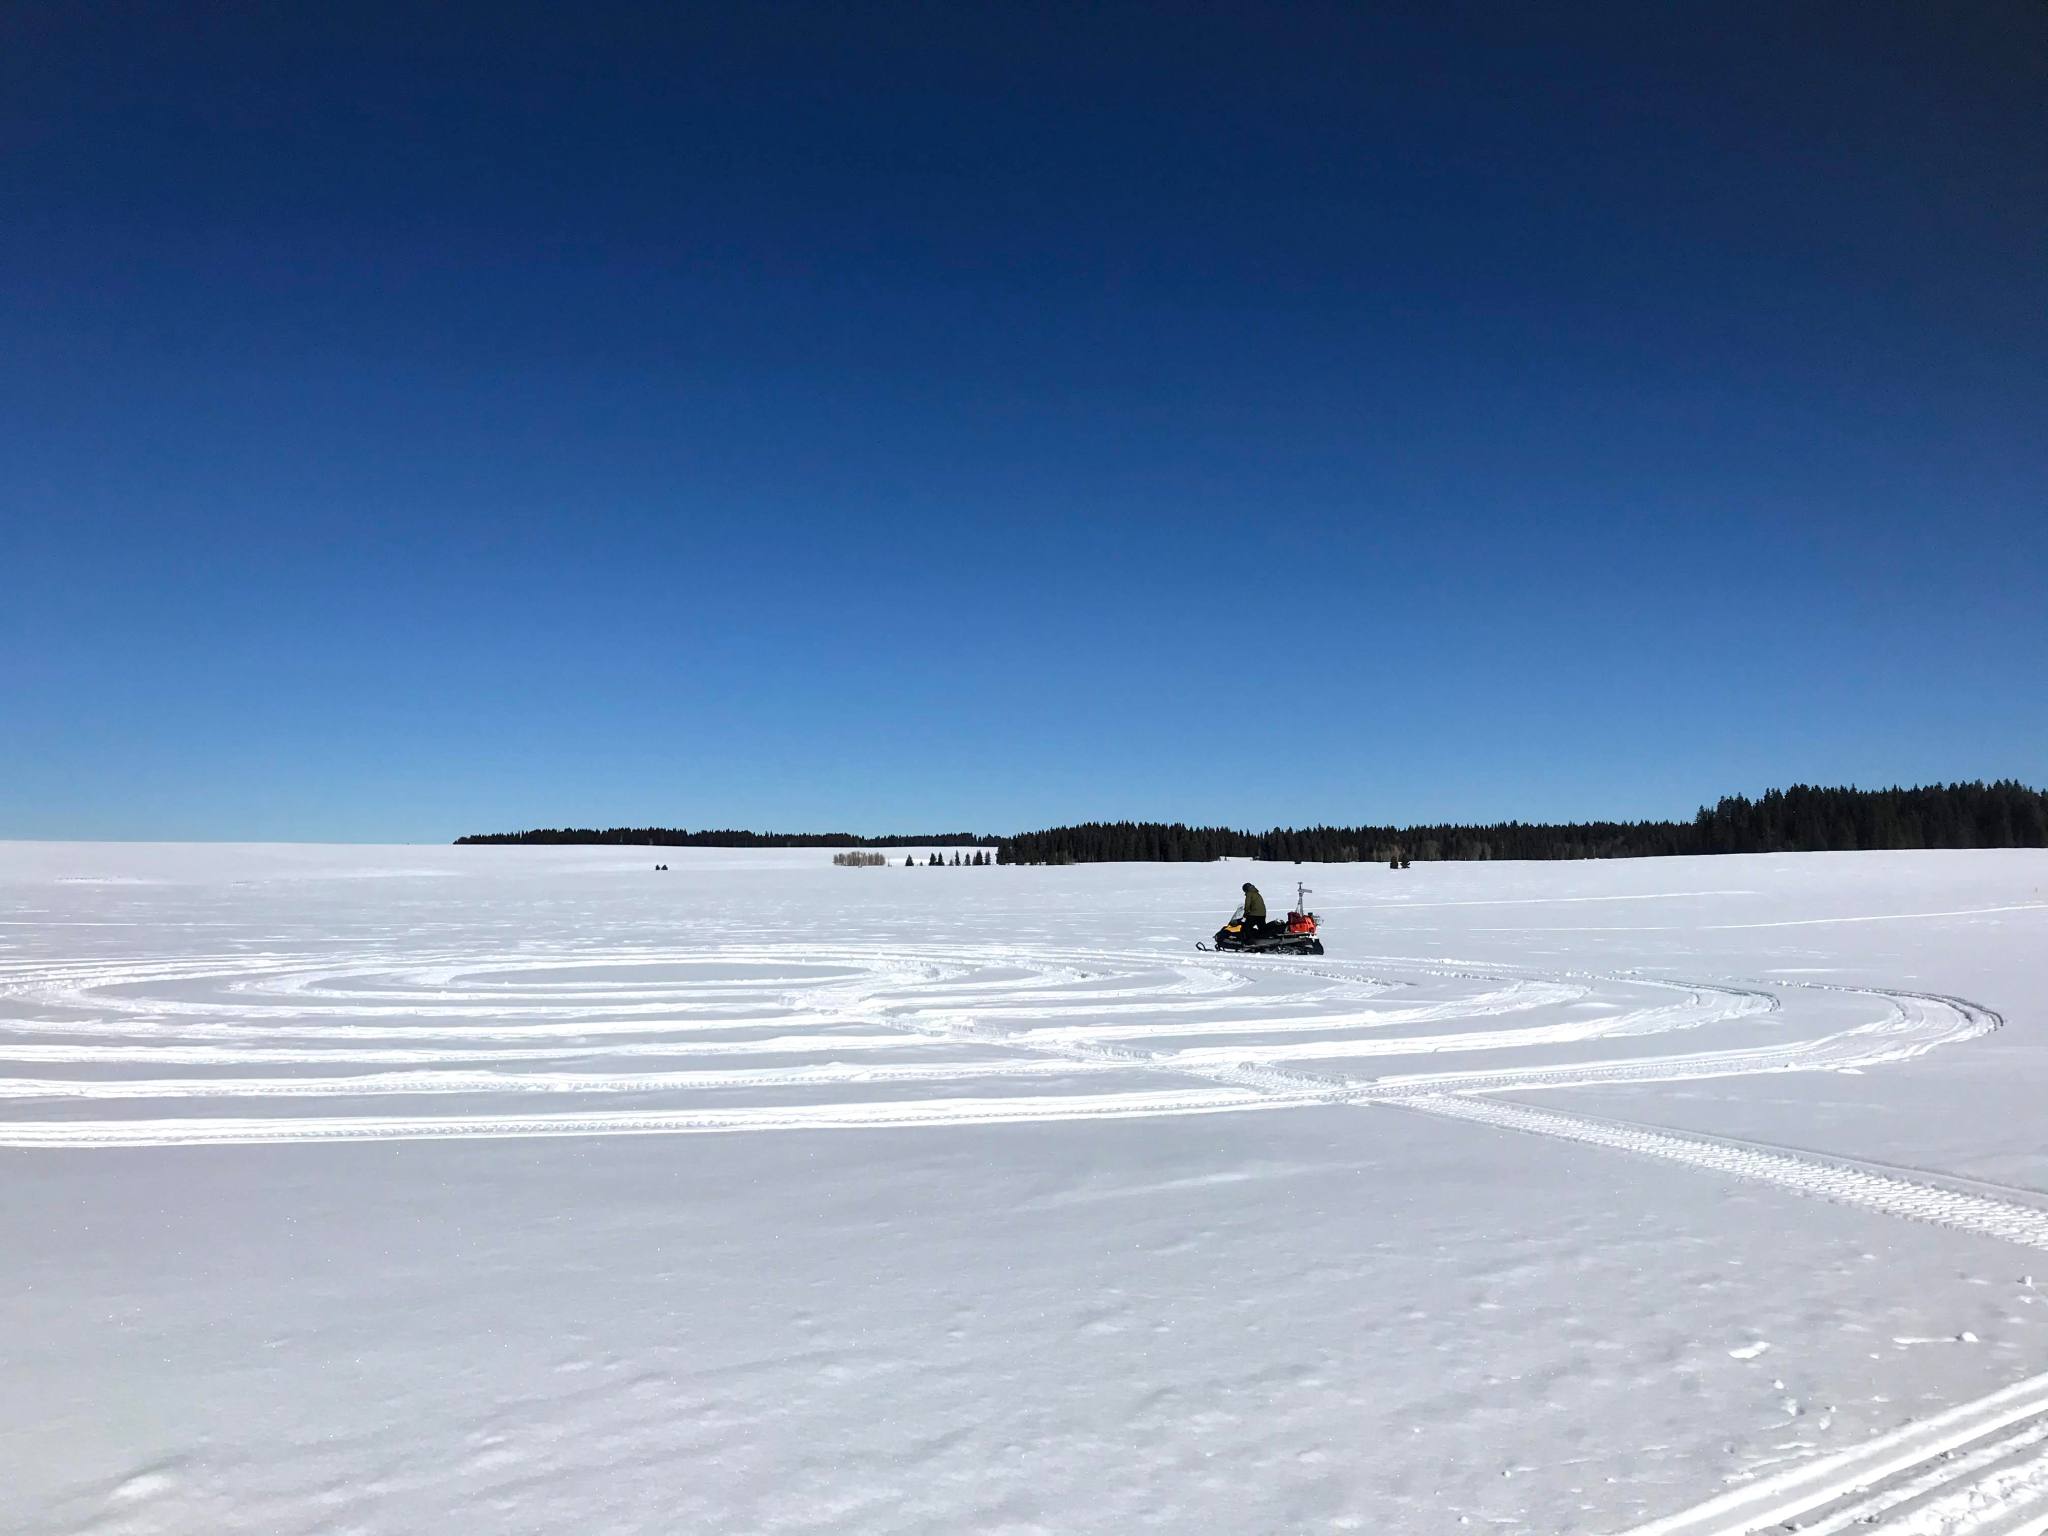
In order to understand the variability in snow properties within these larger remote sensing footprints, the team drove snowmobiles in precise spirals to collect active and passive radar measurements of snow layers, depth and water content, with more continuous sampling.
“When you look at the data mapped out across the mesa it’s amazing how much area we covered. There are interesting spatial patterns in the snow depth data, where the deep snow forms right along the edges of forested areas,” said Vuyovich. “There is shallower snow depth among the trees and it is average out in the open. This snow depth heterogeneity is mostly due to wind redistribution and really demonstrates why we need so many observations to validate the remote sensing observations and test our models.”
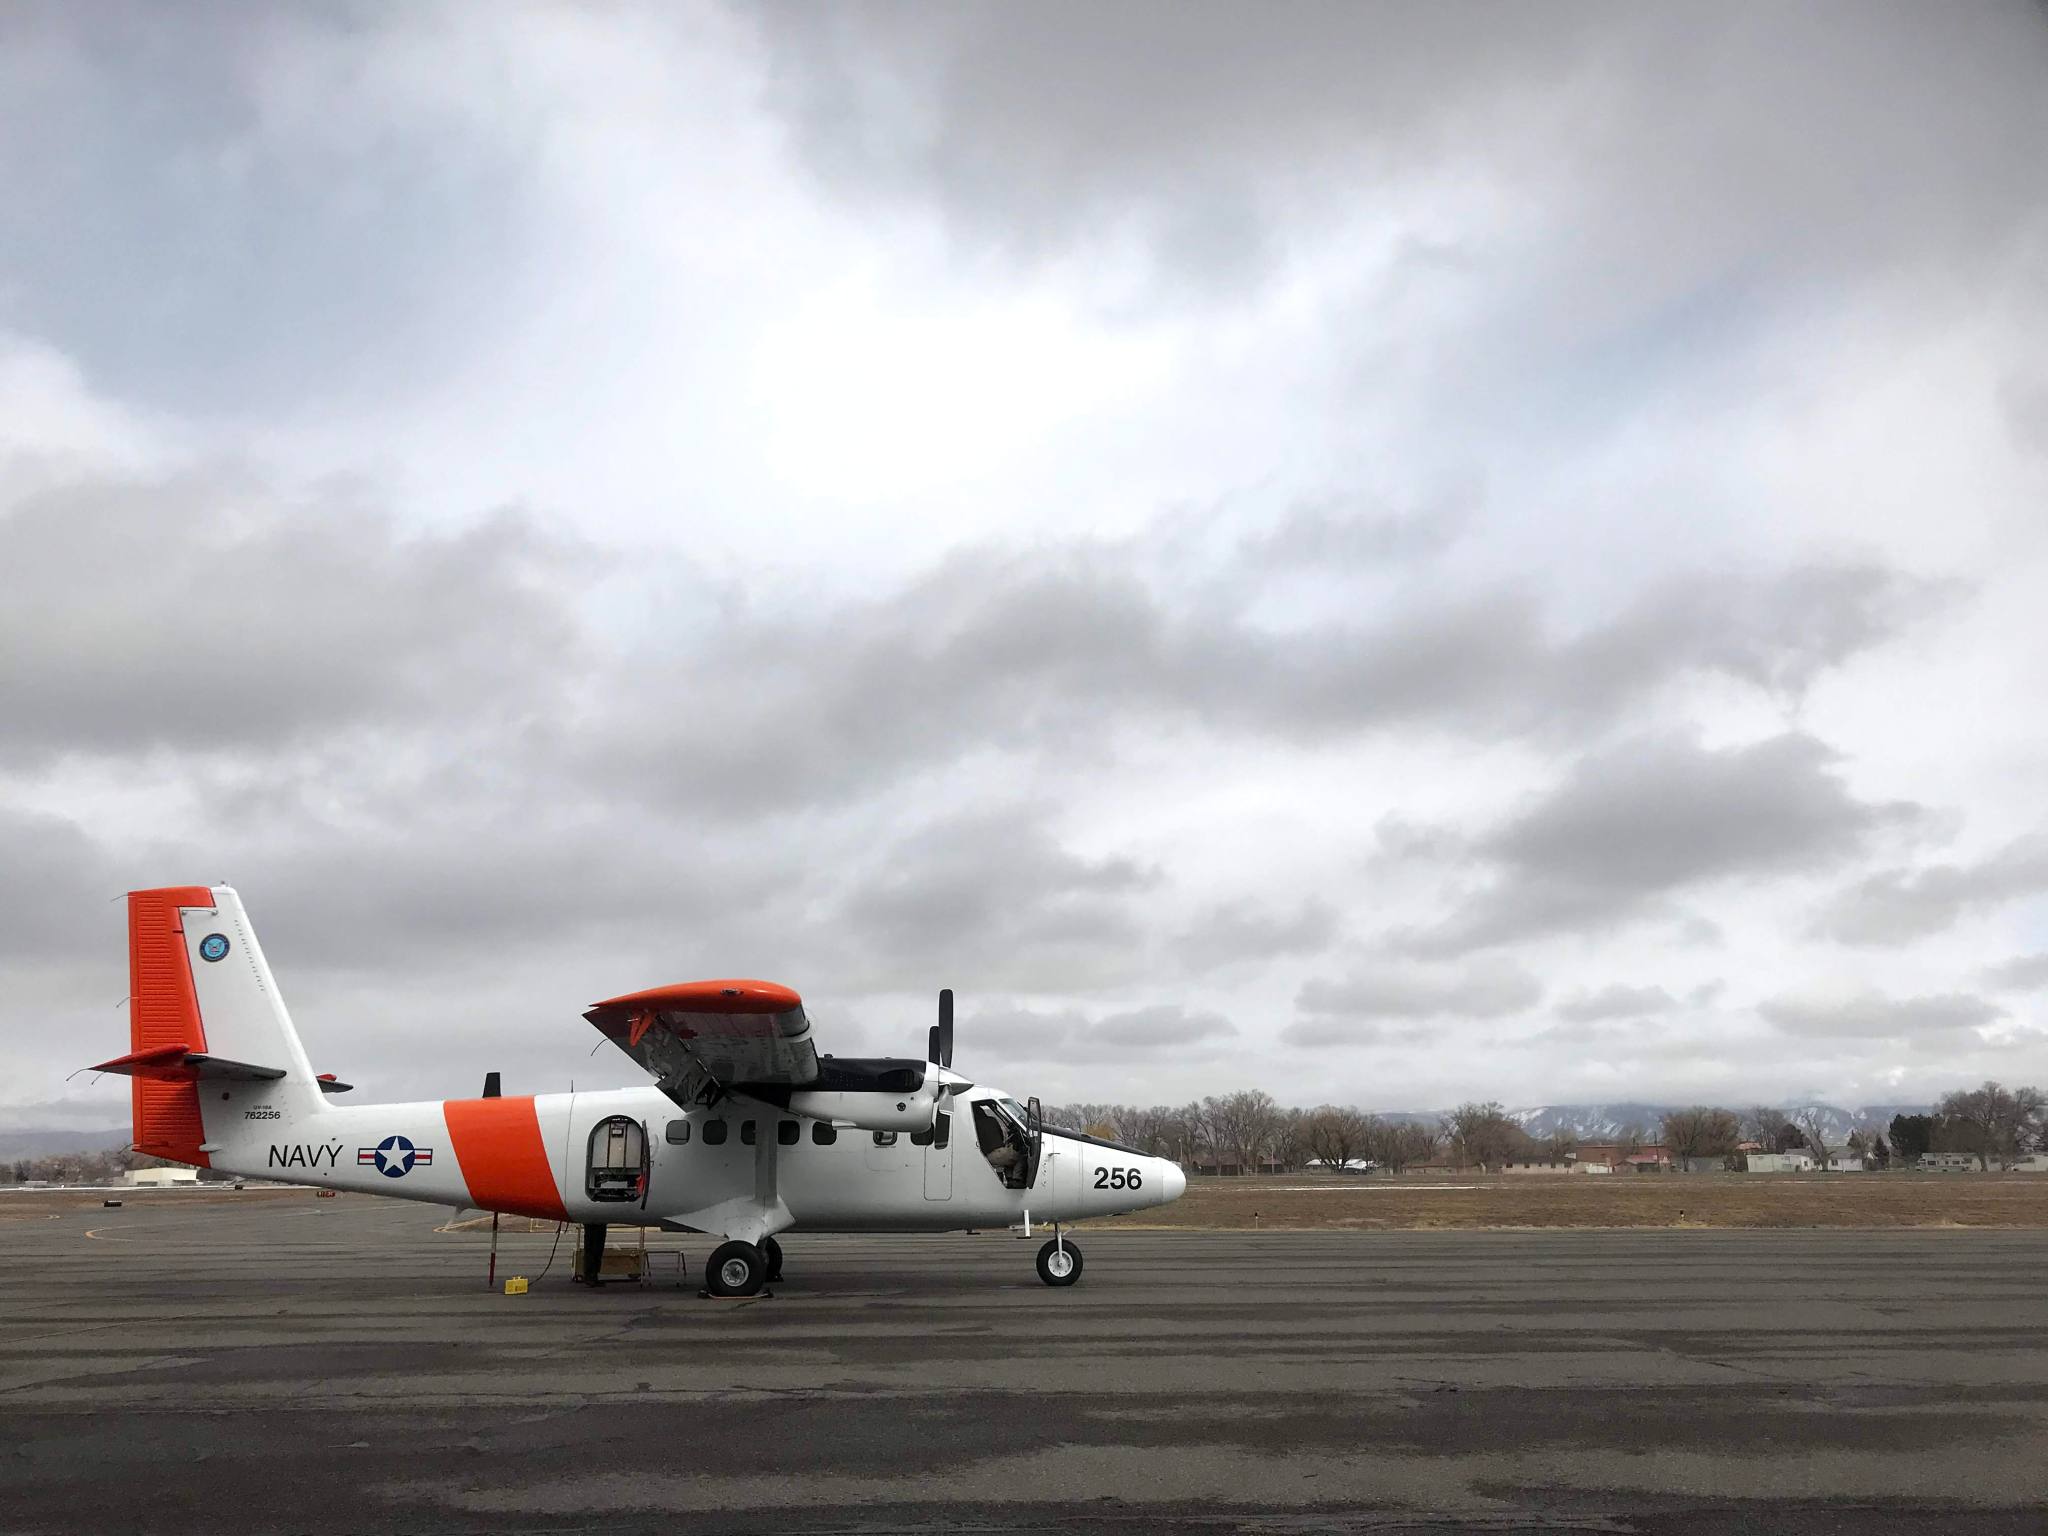
While the ground teams worked in the snow, airborne teams flew precision flight lines overhead carrying instrument combinations that made similar measurements: Radar and lidar (light detection and ranging) for snow depth, microwave radar and radiometers for SWE, optical cameras to photograph the surface, infrared radiometers to measure surface temperature and hyperspectral imagers to document snow cover and composition. One of the seven instruments was developed and built at NASA Goddard: The Snow Water Equivalent Synthetic Aperture Radar and Radiometer, or SWESARR. Another radar, the Uninhabited Aerial Vehicle Synthetic Aperture Radar, or UAVSAR, came from NASA’s Jet Propulsion Laboratory.
The teams also took advantage of overpasses by several NASA satellites, including ICESat-2 and Terra, and the European Space Agency Sentinel-1 mission, to collect additional data to compare. Back on the ground, Vuyovich and her team ran a range of computer models to compare with gathered data later, and see how they compared and might be combined for future analyses.
“The period at Grand Mesa went so well,” said Marshall. “The entire 44-person field crew worked incredibly hard, and in particular, many of the younger students really stepped up. I’m excited about our up-and-coming generation of snow scientists – they will do great things.”
Coordinating both new and mature instruments across a variety of conditions and locations was challenging, Marshall said.
“For a seasonal snow airborne campaign, SnowEx 2020 is unique in that we successfully flew so many instruments over the same location, coordinated with extensive field observations,” he said. “Using those data sets together is going to be really exciting. It will take us a long way toward a better understanding of how to develop a global SWE product that combines data from multiple satellites, field data and modeling.”
As snow melts and gets wetter in the spring, it becomes more challenging to measure. From December 2019 through March 2020, smaller local teams took weekly ground measurements and bimonthly air surveys at 13 sites that span different snow climates, in five different states around the western United States.
Even though the campaign wrapped up early due to the coronavirus pandemic, the team’s wide variety of sampling sites gave them enough data to validate and analyze, said Vuyovich and Marshall. During each overflight, teams at each site measured and entered data into the National Snow and Ice Data Center’s system designed for SnowEx, and both scientists conducted regular check-in calls via videoconferencing.
“There were definitely challenges in remotely managing such a large campaign, but it was a great learning experience,” Vuyovich said. “This kind of campaign is valuable, so knowing what worked and didn’t work has helped us talk about future years and how we might structure things differently.”
The team’s next step is to process and freely distribute the millions of data points they collected at Grand Mesa and during the time series, and they expect to begin finding results later in the year, said Marshall. “This large dataset will be used to help design a future spaceborne approach to mapping SWE globally, using a combination of ground observations, models, and satellite measurements. The SnowEx 2020 data will provide information to allow us to explore tradeoffs in cost, complexity and accuracy.”
To experience the SnowEx 2020 team’s trip to Grand Mesa, check out the bonus episode of NASA’s Curious Universe podcast: https://www.nasa.gov/mediacast/field-notes-grand-mesa-colorado/
To read February 2020 reporting from the field, visit:
https://blogs.nasa.gov/earthexpeditions/2020/02/18/snow-science-two-miles-in-the-sky/
https://blogs.nasa.gov/earthexpeditions/2020/02/19/a-breathtaking-view-literally/

