


What do you give to an ocean that has everything? This year, for National Ocean Month, NASA’s Plankton, Aerosol, Cloud, ocean Ecosystem (PACE) satellite— is gifting us a unique look at our home planet. The visualizations created with data from the satellite, which launched on Feb. 8, are already enhancing the ways that we view our seas and skies.
The PACE satellite views our entire planet every day, returning data at a cadence that allows scientists to track and monitor the rapidly changing atmosphere and ocean, including cloud formation, aerosol movement, and differences in microscopic ocean life over time.
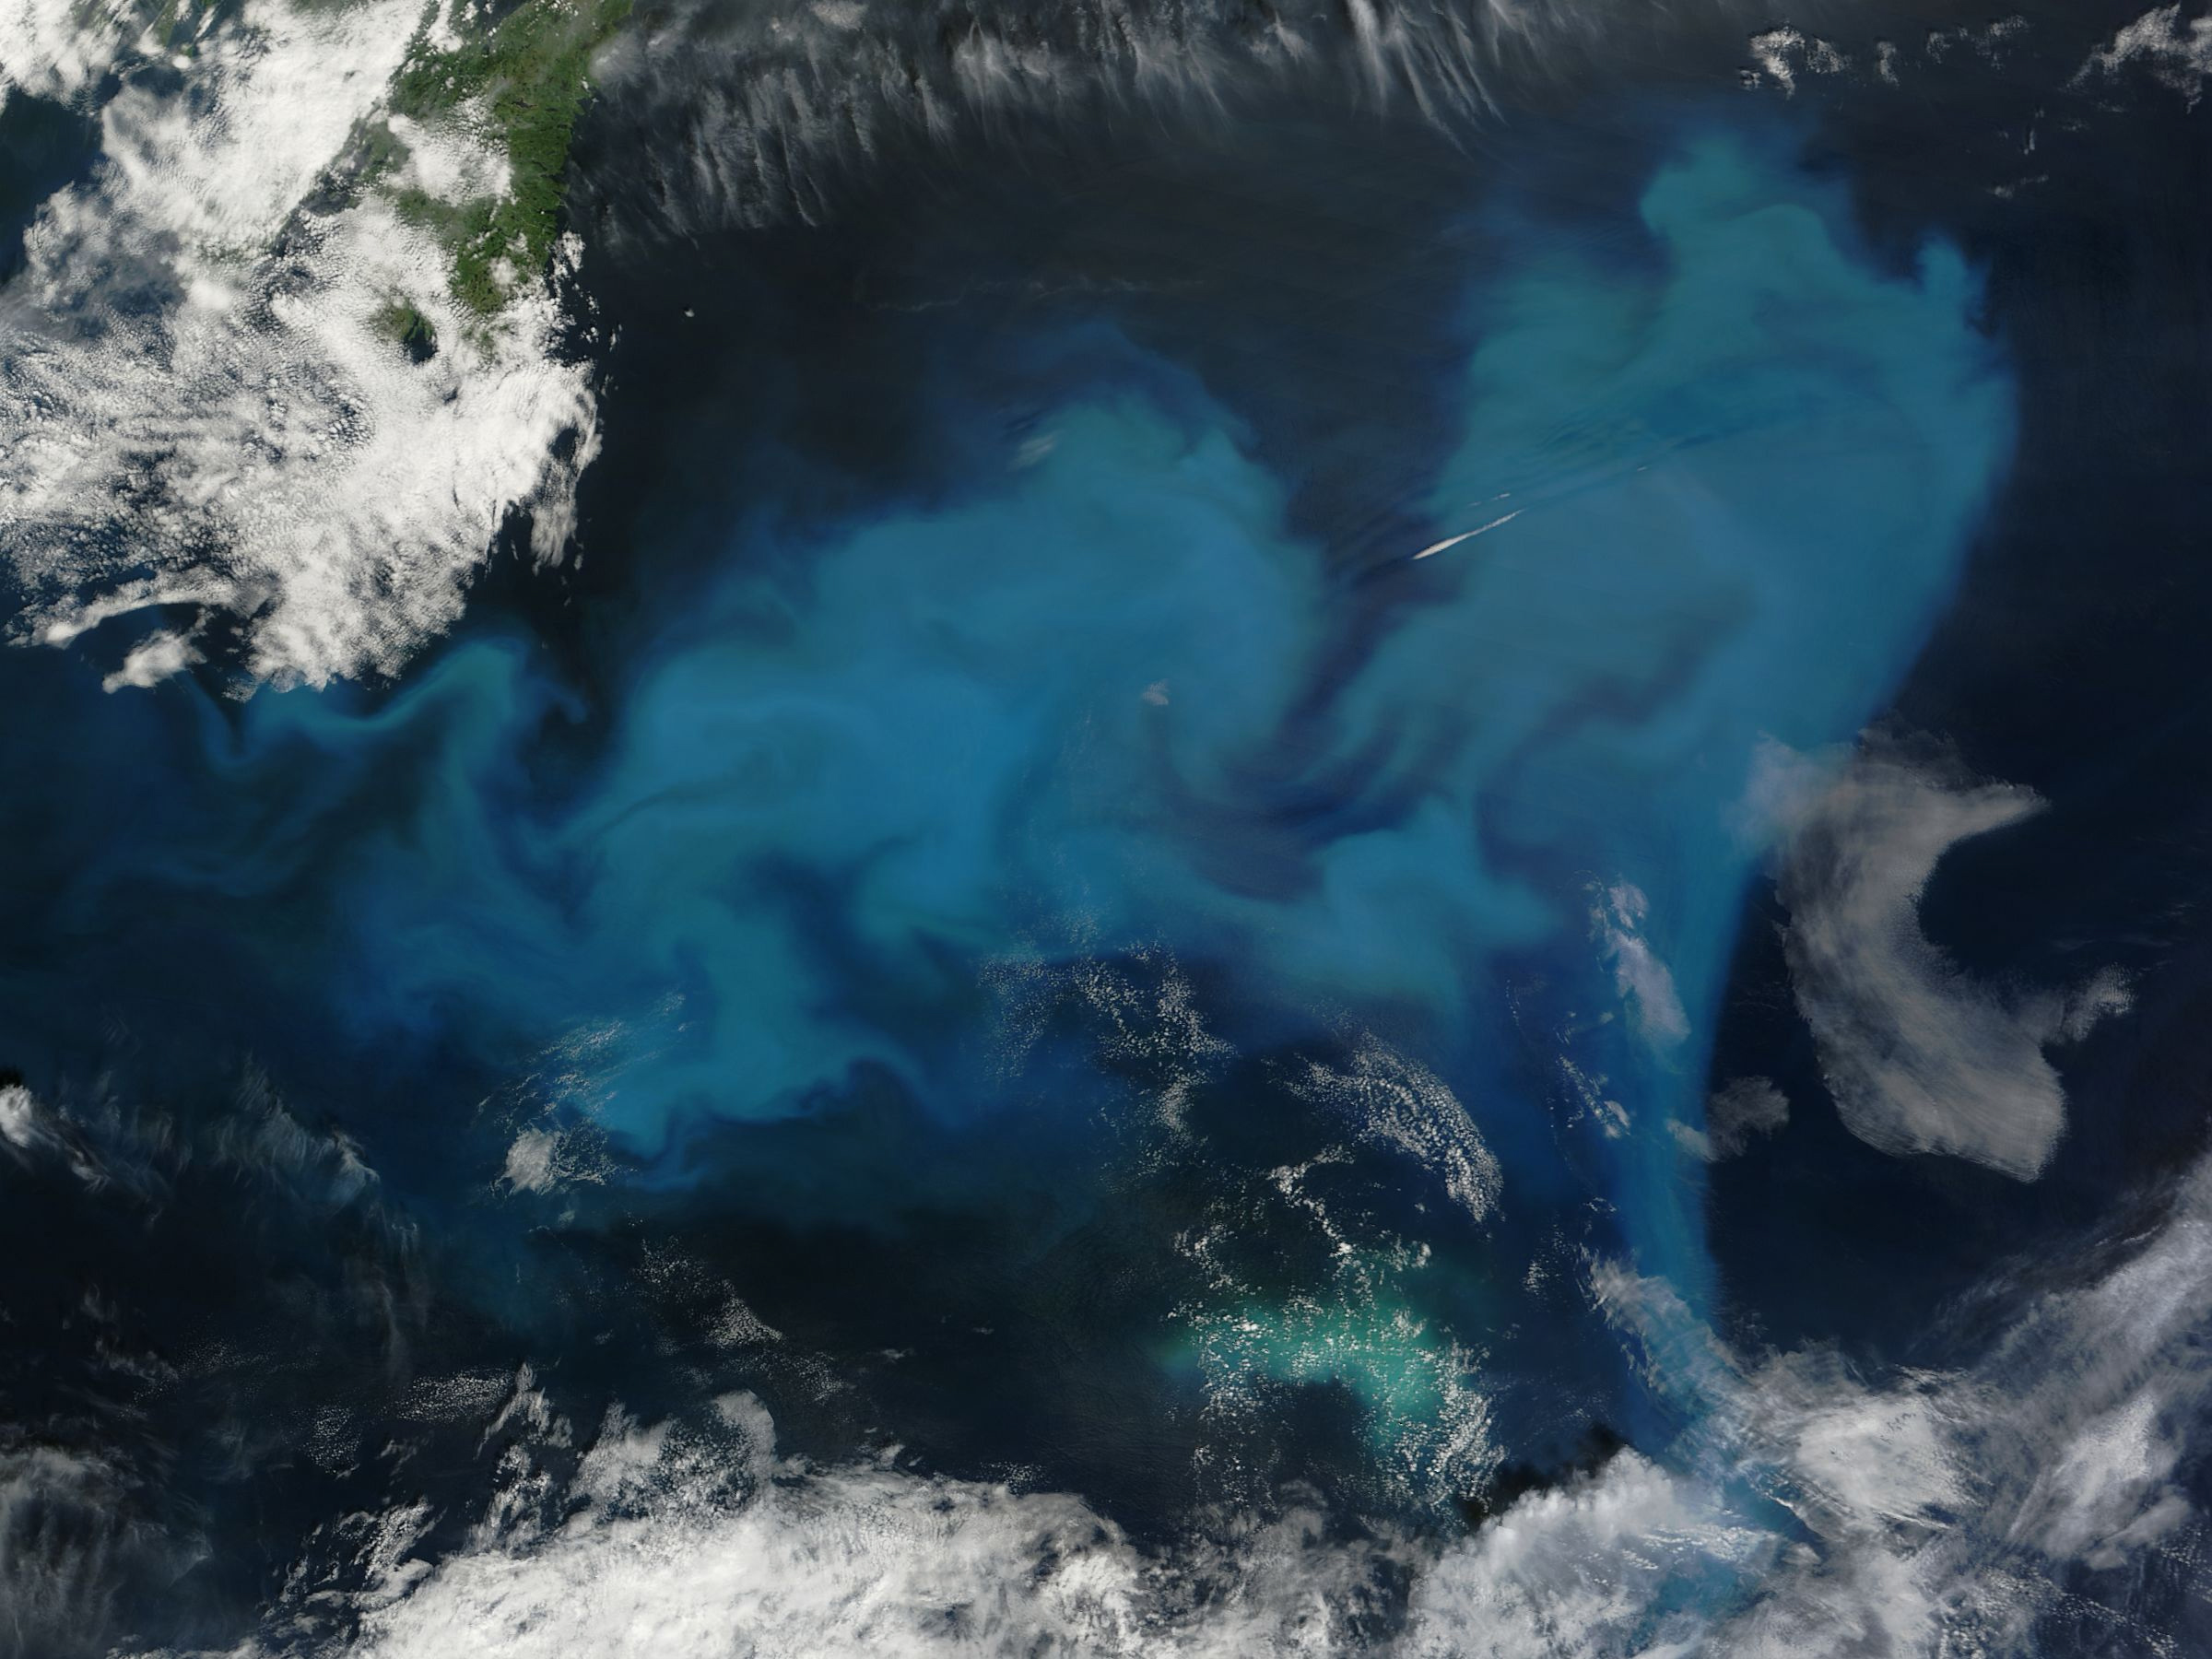
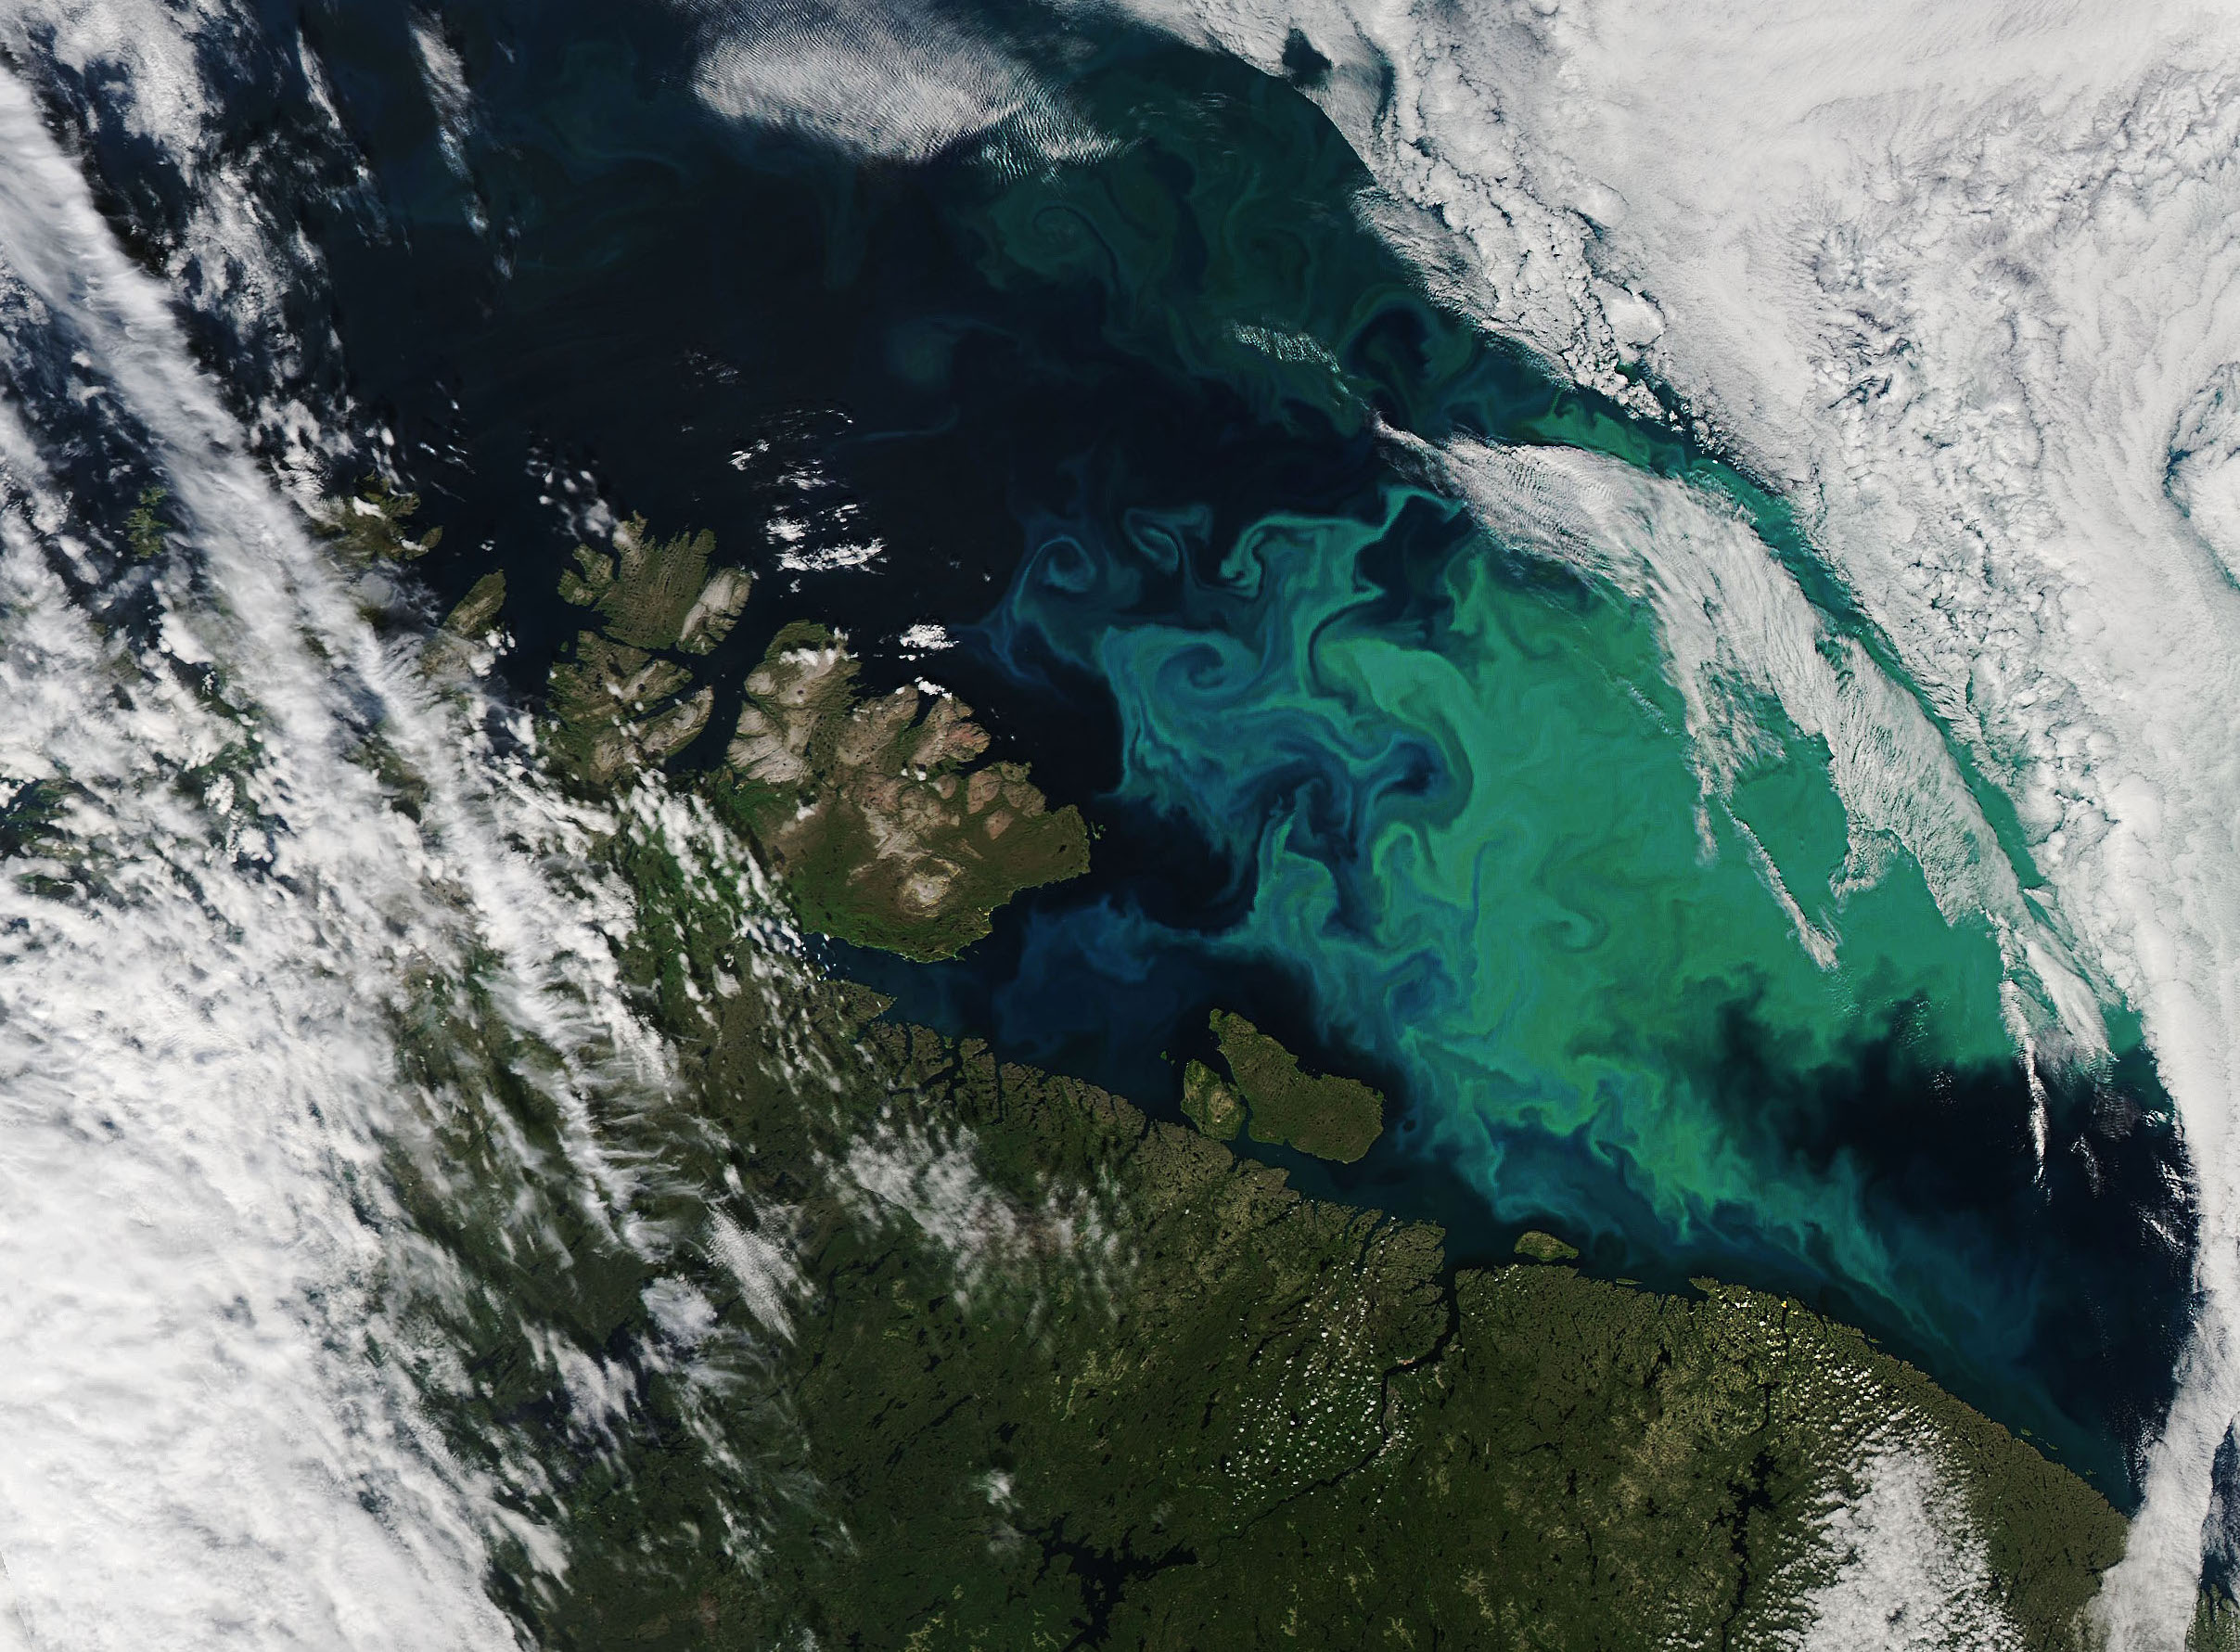
The visualization starts with a view of swaths of Earth from PACE’s Ocean Color Instrument. The Ocean Color Instrument observes Earth in ultraviolet, visible, and near infrared light — over 200 wavelengths. With this level of detail, scientists can now, from space, regularly identify specific communities of phytoplankton — tiny organisms floating near the surface of the ocean that serve as the center of the marine food web. This is a major advance, as different types of phytoplankton play different roles in ocean ecosystems and health.

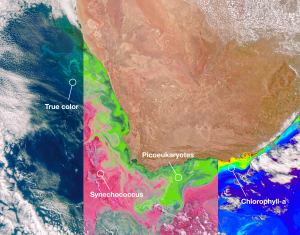
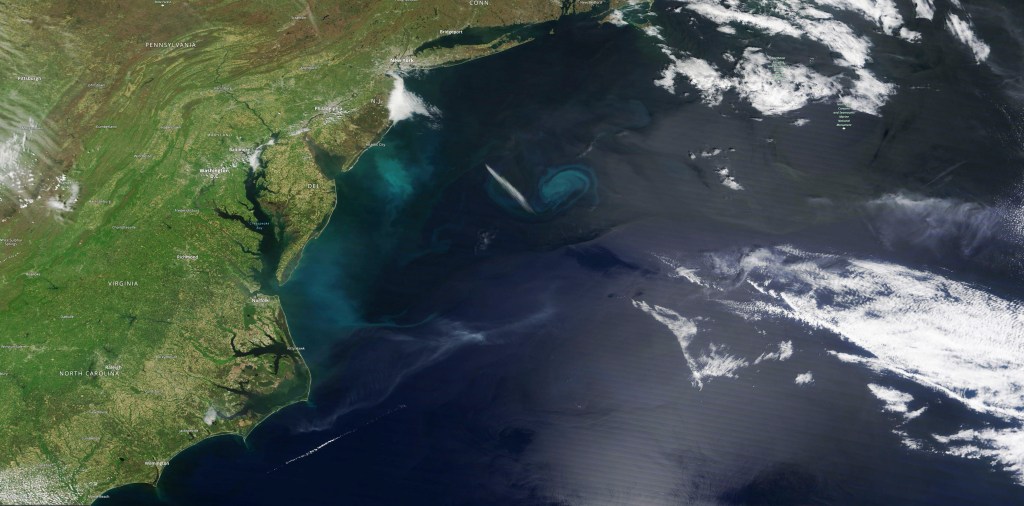
Zooming in, the visualization shows the ecosystems and surrounding atmosphere off the United States’ East Coast and The Bahamas on March 21. Like previous satellites, the Ocean Color Instrument can detect chlorophyll in the ocean, which indicates the presence and abundance of phytoplankton. The Ocean Color Instrument adds to this by allowing scientists to determine the types of phytoplankton present, such as the three different types of phytoplankton identified in the visualization.
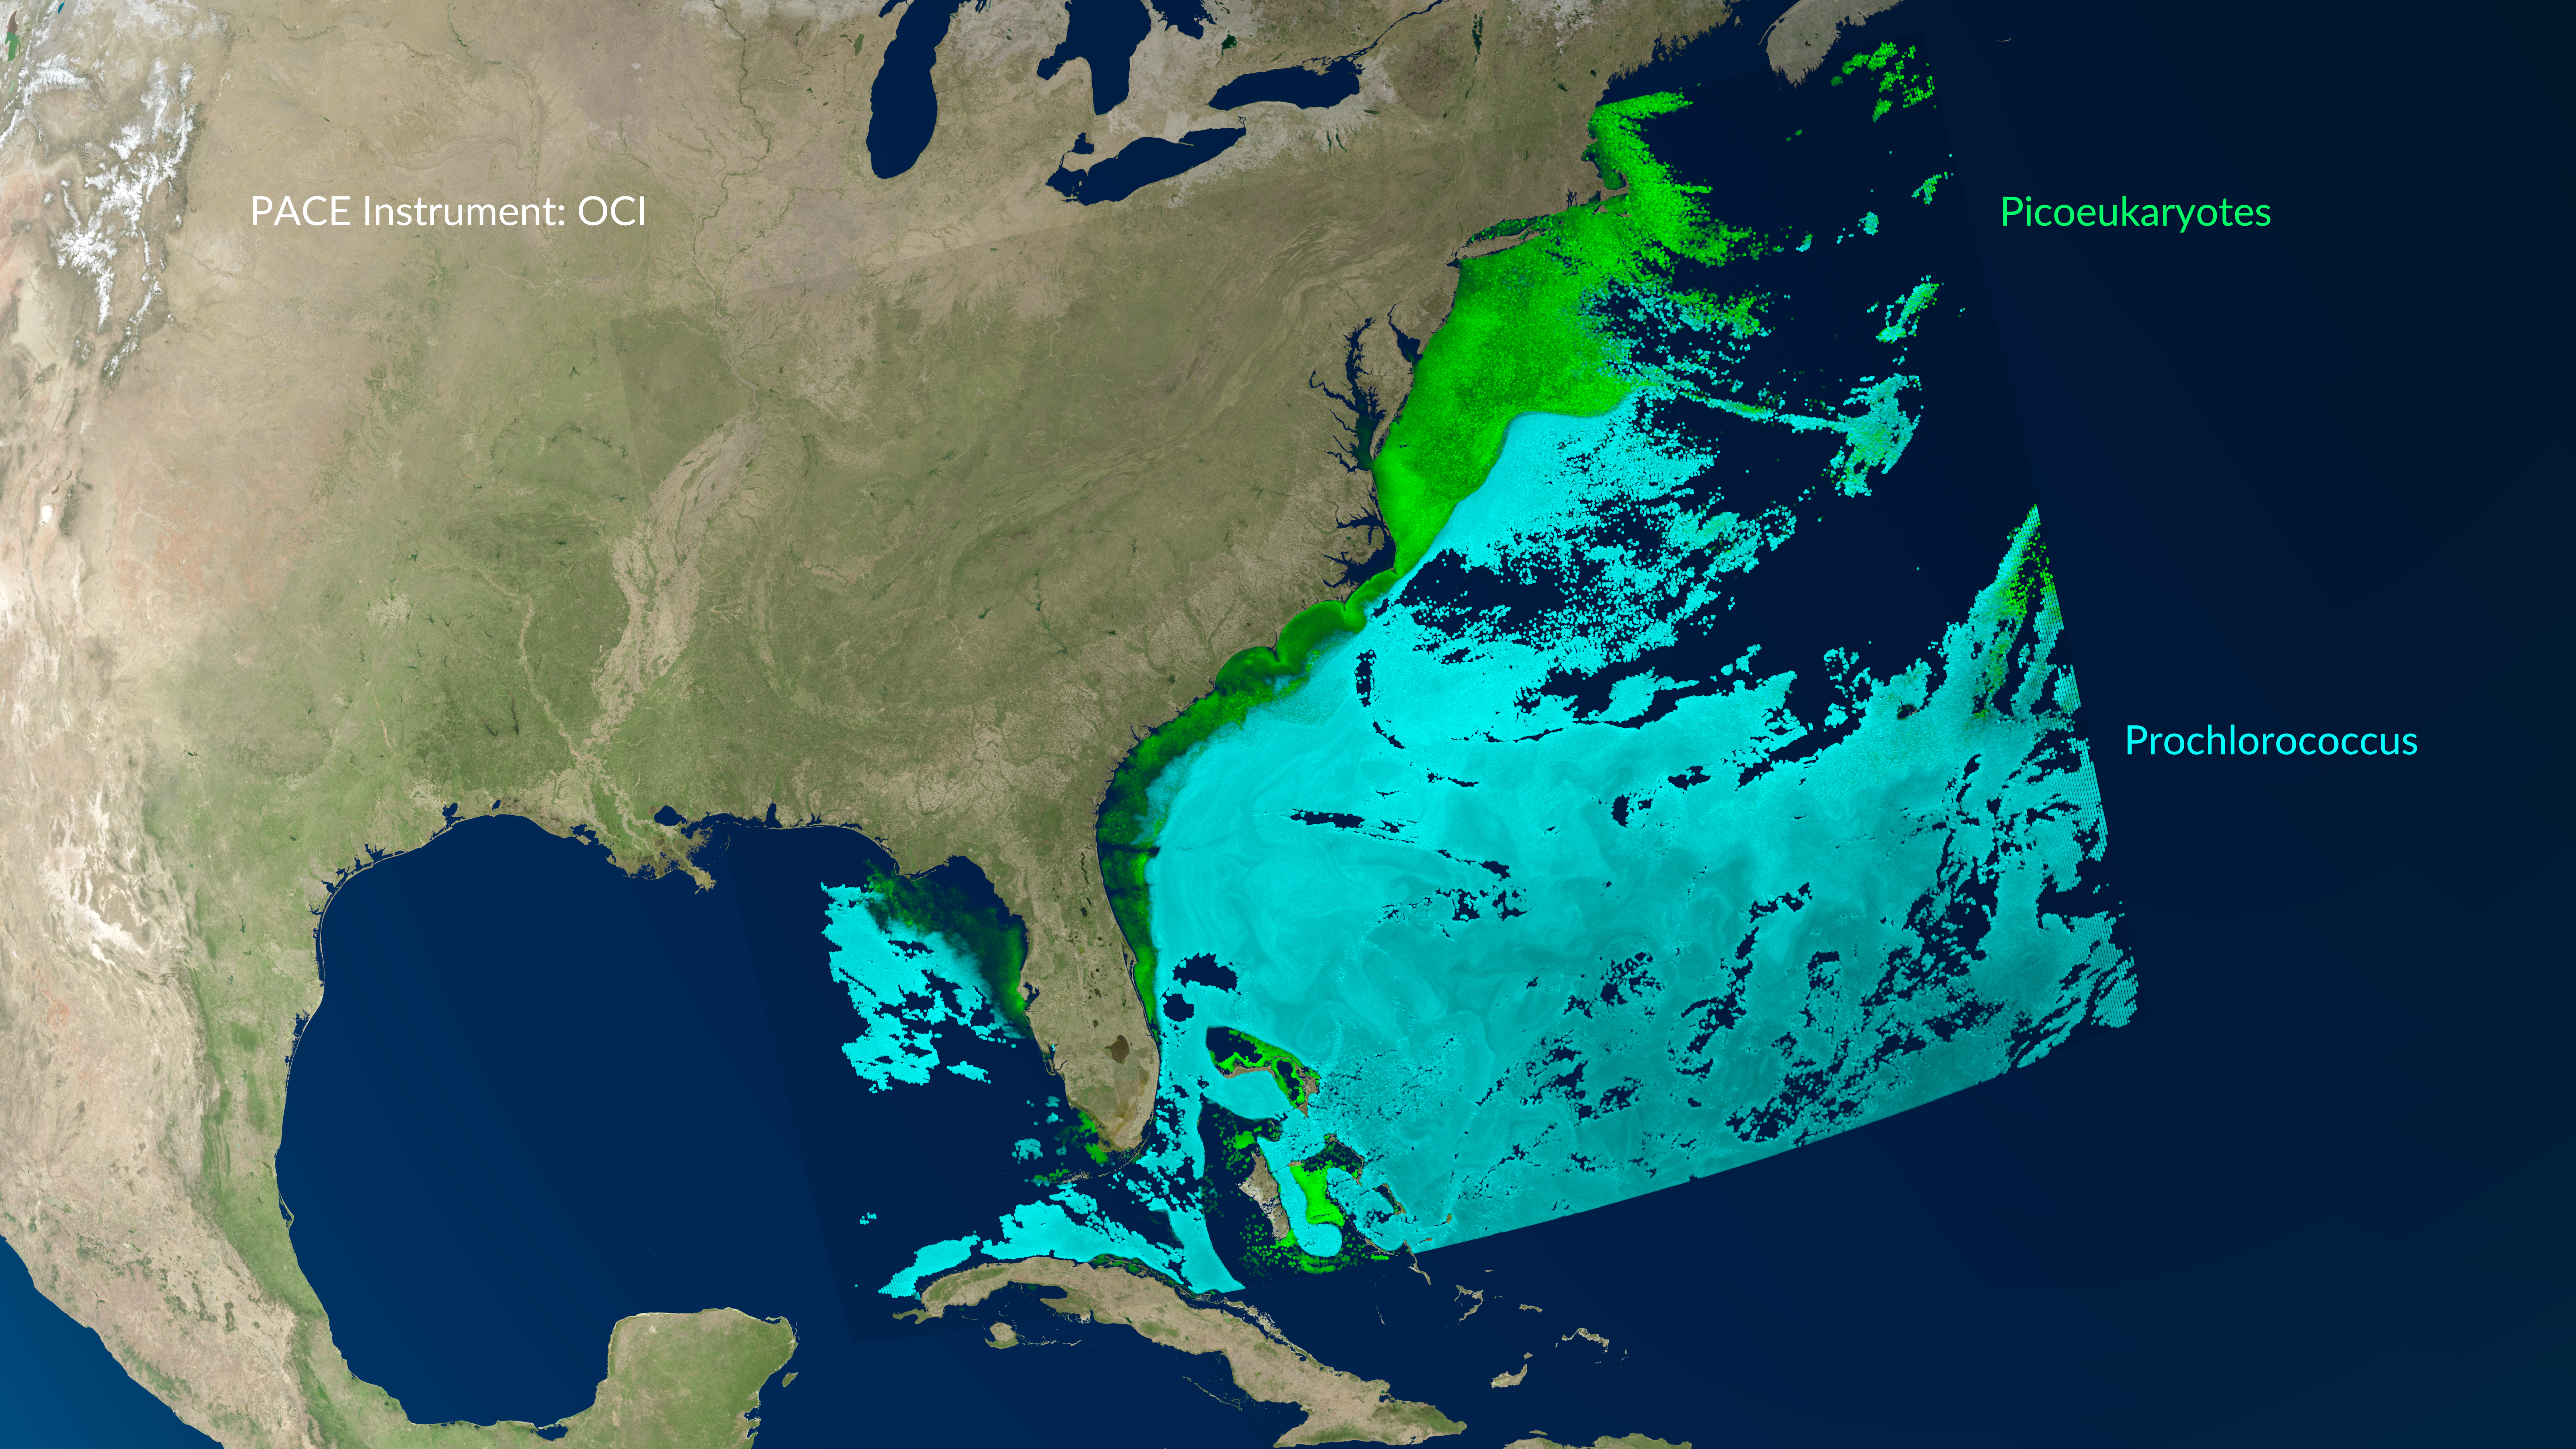
The portion of the swirls in green indicate the presence of picoeukaryotes, organisms which are smaller than 0.3 micrometers in size — 30 times smaller than the width of a human hair. In light blue are prochlorococcus, the smallest known organism to turn sunlight into energy (photosynthesis); they account for a major fraction of all photosynthesis that occurs in the ocean. The portion of the bloom in bright pink indicates synechococcus, a phytoplankton group that can color the water light pink when many are present in a small area.

These are just three of the thousands of types of phytoplankton, and just the start of what the Ocean Color Instrument will be able to identify.
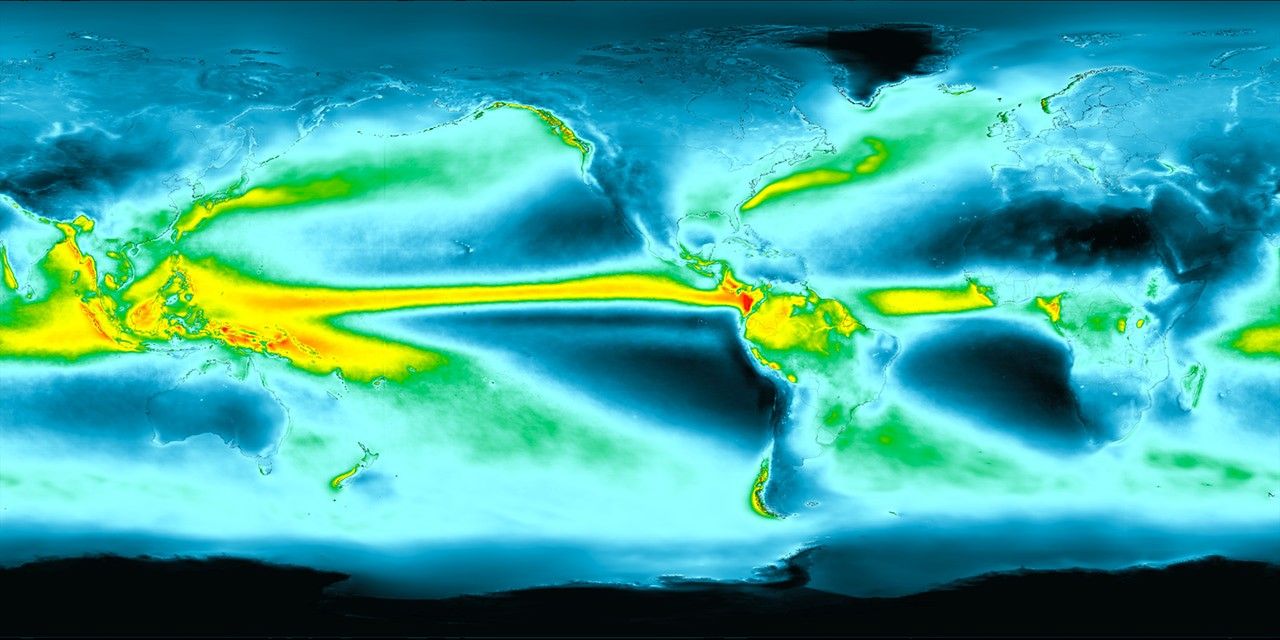
The PACE satellite’s two polarimeters, Hyper-Angular Rainbow Polarimeter #2 (HARP2) and Spectro-polarimeter for Planetary Exploration one (SPEXone), provide a unique view of Earth’s atmosphere, helping scientists learn more about clouds and small particles called aerosols. The polarimeters measure light that reflects off of these particles. By learning more about the interactions between clouds and aerosols, these data will ultimately help make climate models more accurate. Additionally, aerosols can degrade air quality, so monitoring their properties and movement is important for human health.
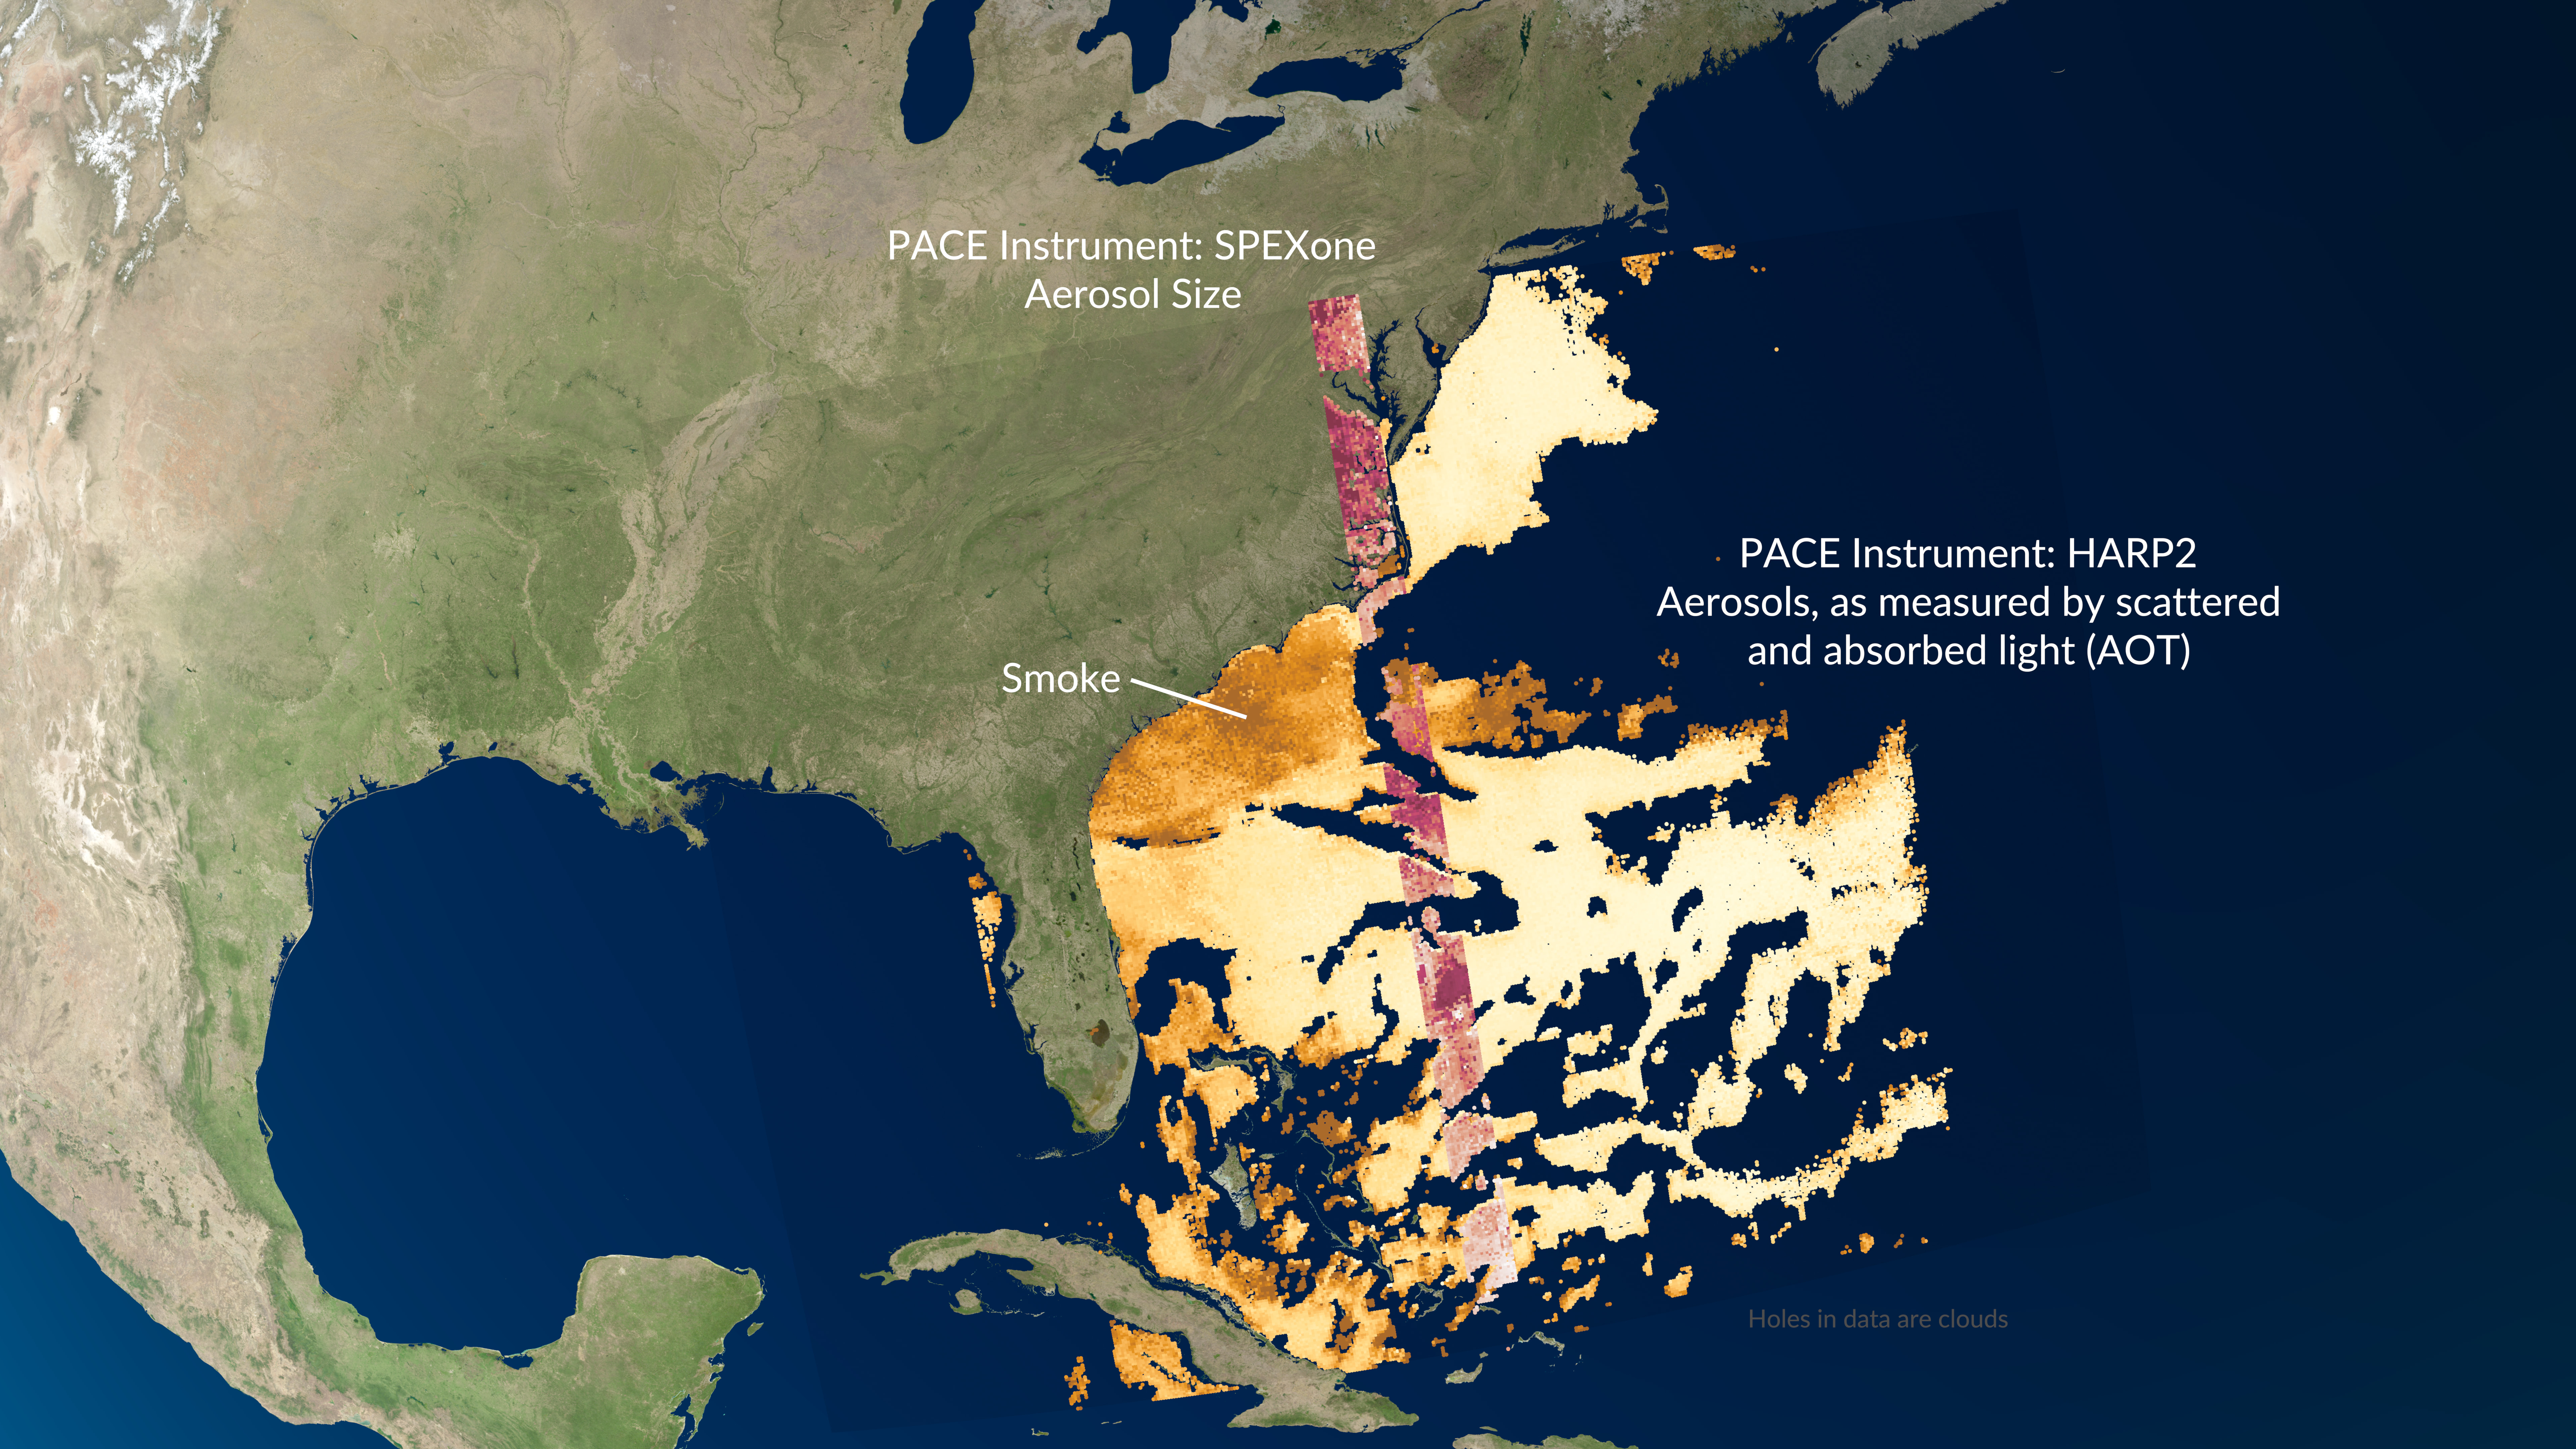
In the visualization, the large swath of HARP2 data shows the concentration of aerosols in the air for that particular day. These data — a measure of the light scattering and absorbing properties of aerosols — help scientists not only locate the aerosols, but identify the type. Near the coast, the aerosols are most likely smoke from fires in the U.S. southeast. Adding detail to the visualization and the science, the thin swath of SPEXone data furthers the information by showing the aerosol particle size.
Over the next year, PACE scientists aim to create the first global maps of phytoplankton communities and glean new insights into how fisheries and aquatic resources are responding to Earth’s changing climate.
NASA’s Goddard Space Flight Center, Greenbelt, Md.