September 2020 issue of Ames' newsletter the Astrogram
Scalable Traffic Management Goal to Assist with Emergency Response Operations
For faster, smarter, safer emergency response operations, the STEReO project is combining NASA technologies and partnerships to build a system that’s greater than the sum of its parts
by Abigail Tabor
When a natural disaster occurs, an impressive number of participants are often needed to help with the response. Consider just the number of different aircraft that might be involved in fighting a wildfire: tankers releasing fire retardant, lead planes to guide them, helicopters dropping off field crews, aircraft from which smokejumpers arrive on the scene… And that’s to say nothing of the activity taking place on the ground. Responding to an emergency like this – or a hurricane or search and rescue effort, to name a few – requires extensive collaboration among a host of groups that, right now, is coordinated manually under challenging conditions. This makes communication difficult.
New technologies have great potential to assist emergency responders, but they also bring new challenges. For instance, unmanned aircraft systems, commonly called UAS or drones, could make firefighters’ interventions faster, more targeted and better able to adapt to changing environments. However, these aircraft also demand special air traffic management, onboard tools to let them operate independently and safely, and expanded communications to keep everyone aware of what’s happening in the sky and on the ground.
Working to tackle these challenges and more is the Scalable Traffic Management for Emergency Response Operations project, or STEReO, led by NASA’s Ames Research Center in California’s Silicon Valley. By building on NASA technologies and expertise and bringing together solutions from multiple agencies involved in disaster response, STEReO aims to make an impact greater than any solution could have on its own. The work, which is a collaboration between Ames and two other NASA centers – Langley Research Center in Hampton, Virginia, and Glenn Research Center in Cleveland, Ohio – is a concept study under NASA’s Convergent Aeronautics Solutions initiative. The results of the CAS study, designed to determine STEReO’s feasibility, will be used to determine whether and how NASA will pursue further development.
STEReO’s Ecosystem for Emergency Response
STEReO envisions a new ecosystem for emergency response that has three broad goals: reduce response times, scale up the role of aircraft and provide operations that can adapt to rapidly changing conditions during a disaster. To demonstrate how its tools and concepts can achieve these goals in different emergency scenarios, STEReO will conduct a live flight demonstration of a wildfire event and a virtual simulation of a hurricane response.
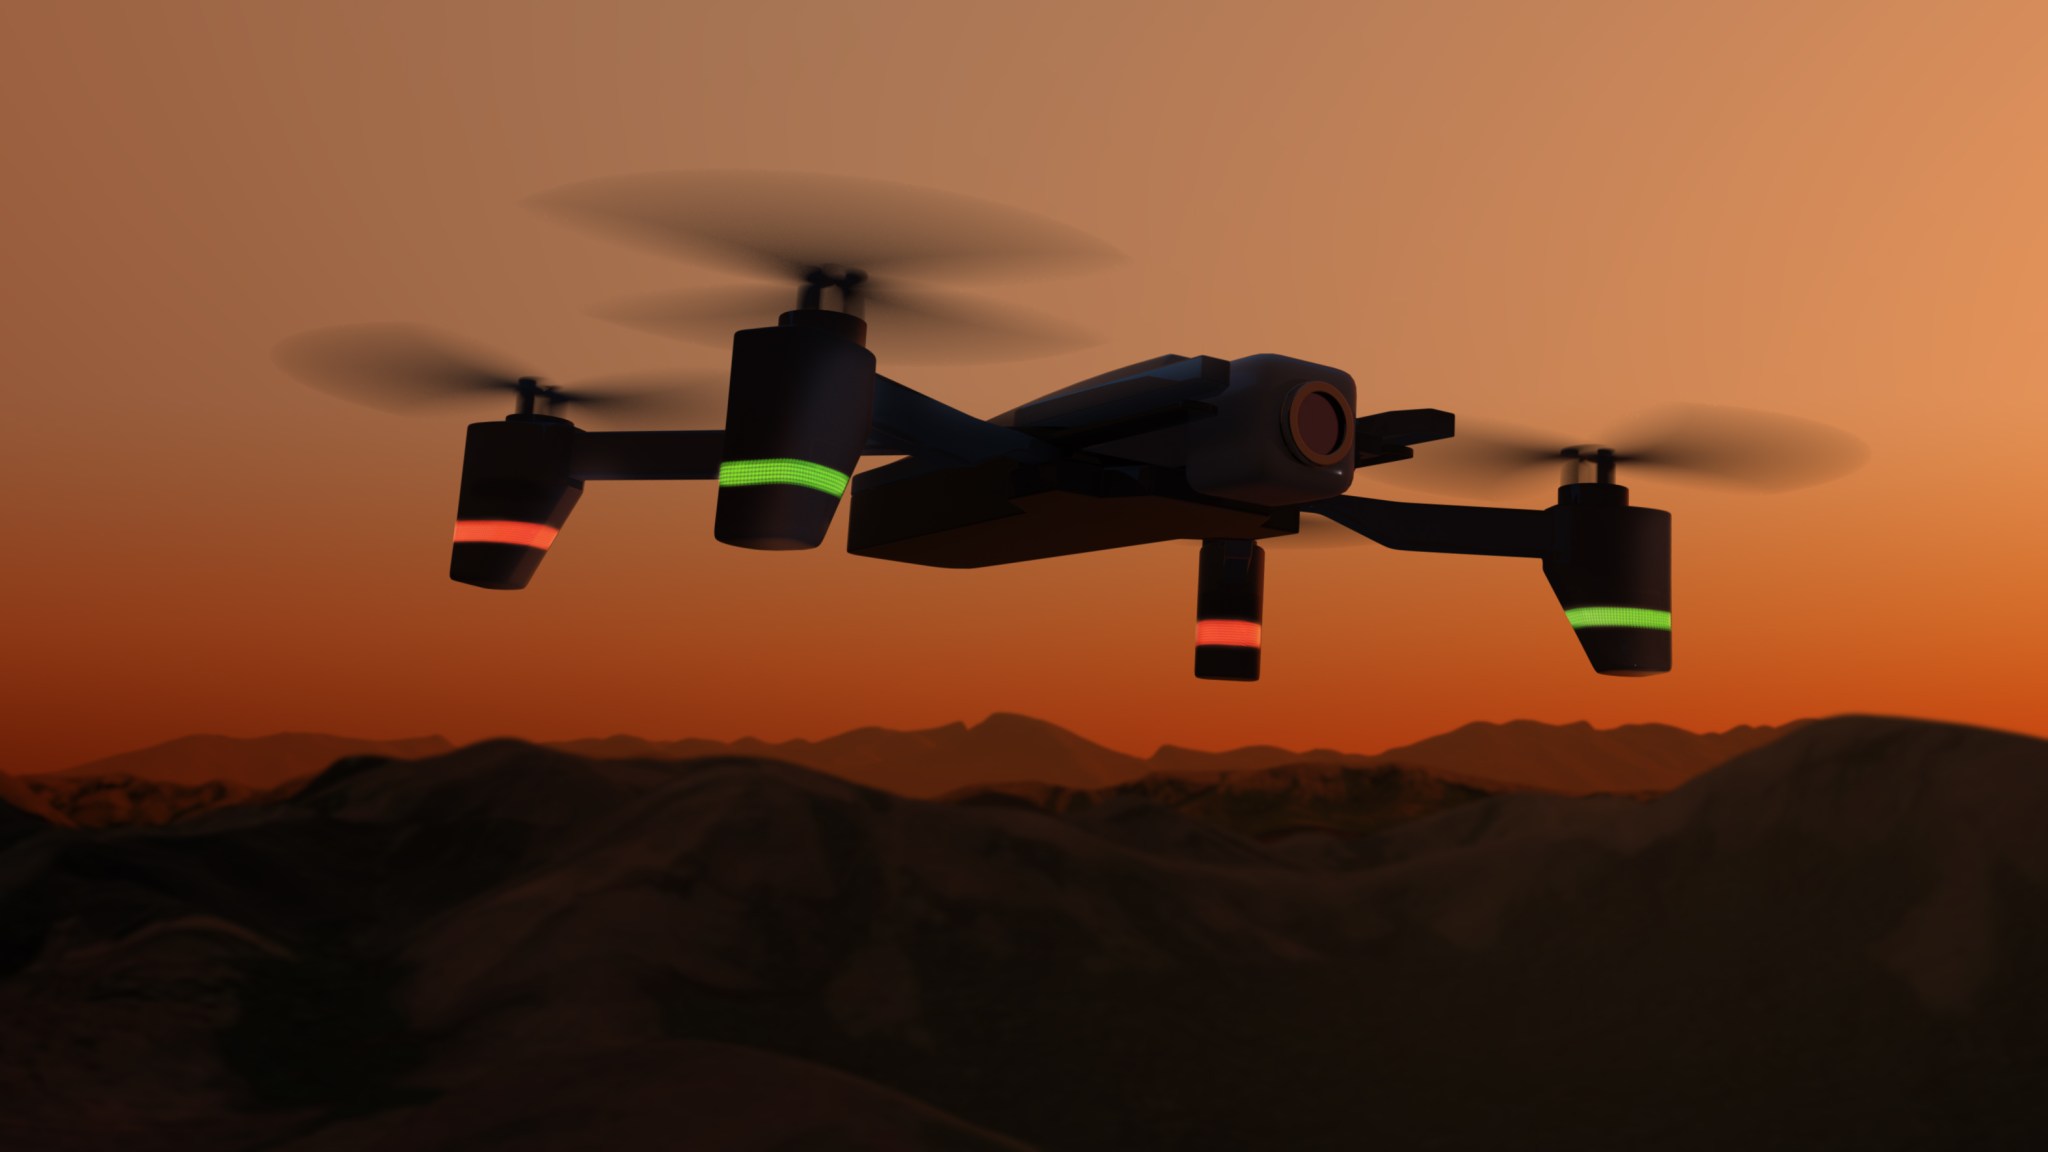
In both cases, they will build on NASA expertise in diverse areas, including air traffic management, human factors research and autonomous technology development. This background, along with input from collaborators – STEReO’s partners range from federal agencies to city and state fire departments, utilities, and private companies – lets the team explore specific concepts like:
- Applying NASA’s Unmanned Aircraft Systems Traffic Management System, or UTM, to public safety uses, coordinating use of the airspace for both crewed and uncrewed aircraft operations
- Collaborative tools to take remote sensing information, such as from sensors on aircraft able to find gas leaks after an earthquake, and distribute a common picture of mission operations
- Communication networks to make the system more resilient to challenging operational environments
- Technologies for more autonomous UAS flight to ensure those operations are both safe and responsive to dynamic situations.
STEReO’s approach will bring increased awareness for all partners responding to an emergency, which could allow for earlier detection of problems and rapid decision making. The full package of STEReO’s emergency response ecosystem could also be scaled to the size and complexity of the specific environment, operations and objectives.
2020 Wildfire Fighting Training:
In June 2020, STEReO team members attended a training activity for wildland firefighting, learning firsthand about a key role in this type of disaster response: the air tactical group supervisor, who acts as an airborne air traffic controller for all those planes and helicopters that help fight fires. Hosted by the California Department of Forestry and Fire Protection, this was a significant opportunity for the project to assess the current state of operations and understand components needed for their own flight demonstration. The experience revealed new potential collaborations where NASA know-how in air traffic management, UAS autonomy, UTM, and human factors can help these emergency responders do their jobs more effectively and safely.
Milestones:
- STEReO Stakeholder Workshop (Feb. 11-13, 2020)
- Firefighting field work: Air Tactical Group Supervisor Training (June 2020)
- First airborne assessment of the STEReO project (fall 2020, tentative)
- Wildfire flight demonstration (spring 2021, tentative)
- Simulation of STEReO’s use in hurricane emergency response (fall 2021, tentative)
Collaborators:
NASA’s STEReO team is working with government and industry partners, including the U.S. Forest Service, the Federal Aviation Administration, the California Department of Forestry and Fire Protection, Microsoft, AiRXOS, Inc. and Avision Inc.
STEReO is an execution activity of NASA’s Convergent Aeronautics Solutions project under the Transformative Aeronautics Concepts Program funded through the Aeronautics Research Mission Directorate.
Learn more:
- NASA article: Drones for Disaster Response: NASA STEReO Project Kicks Off
- NASA article: What is Unmanned Aircraft Systems Traffic Management?
Transforming Water Management in the U.S. West with NASA Data
by Maddie Ecker
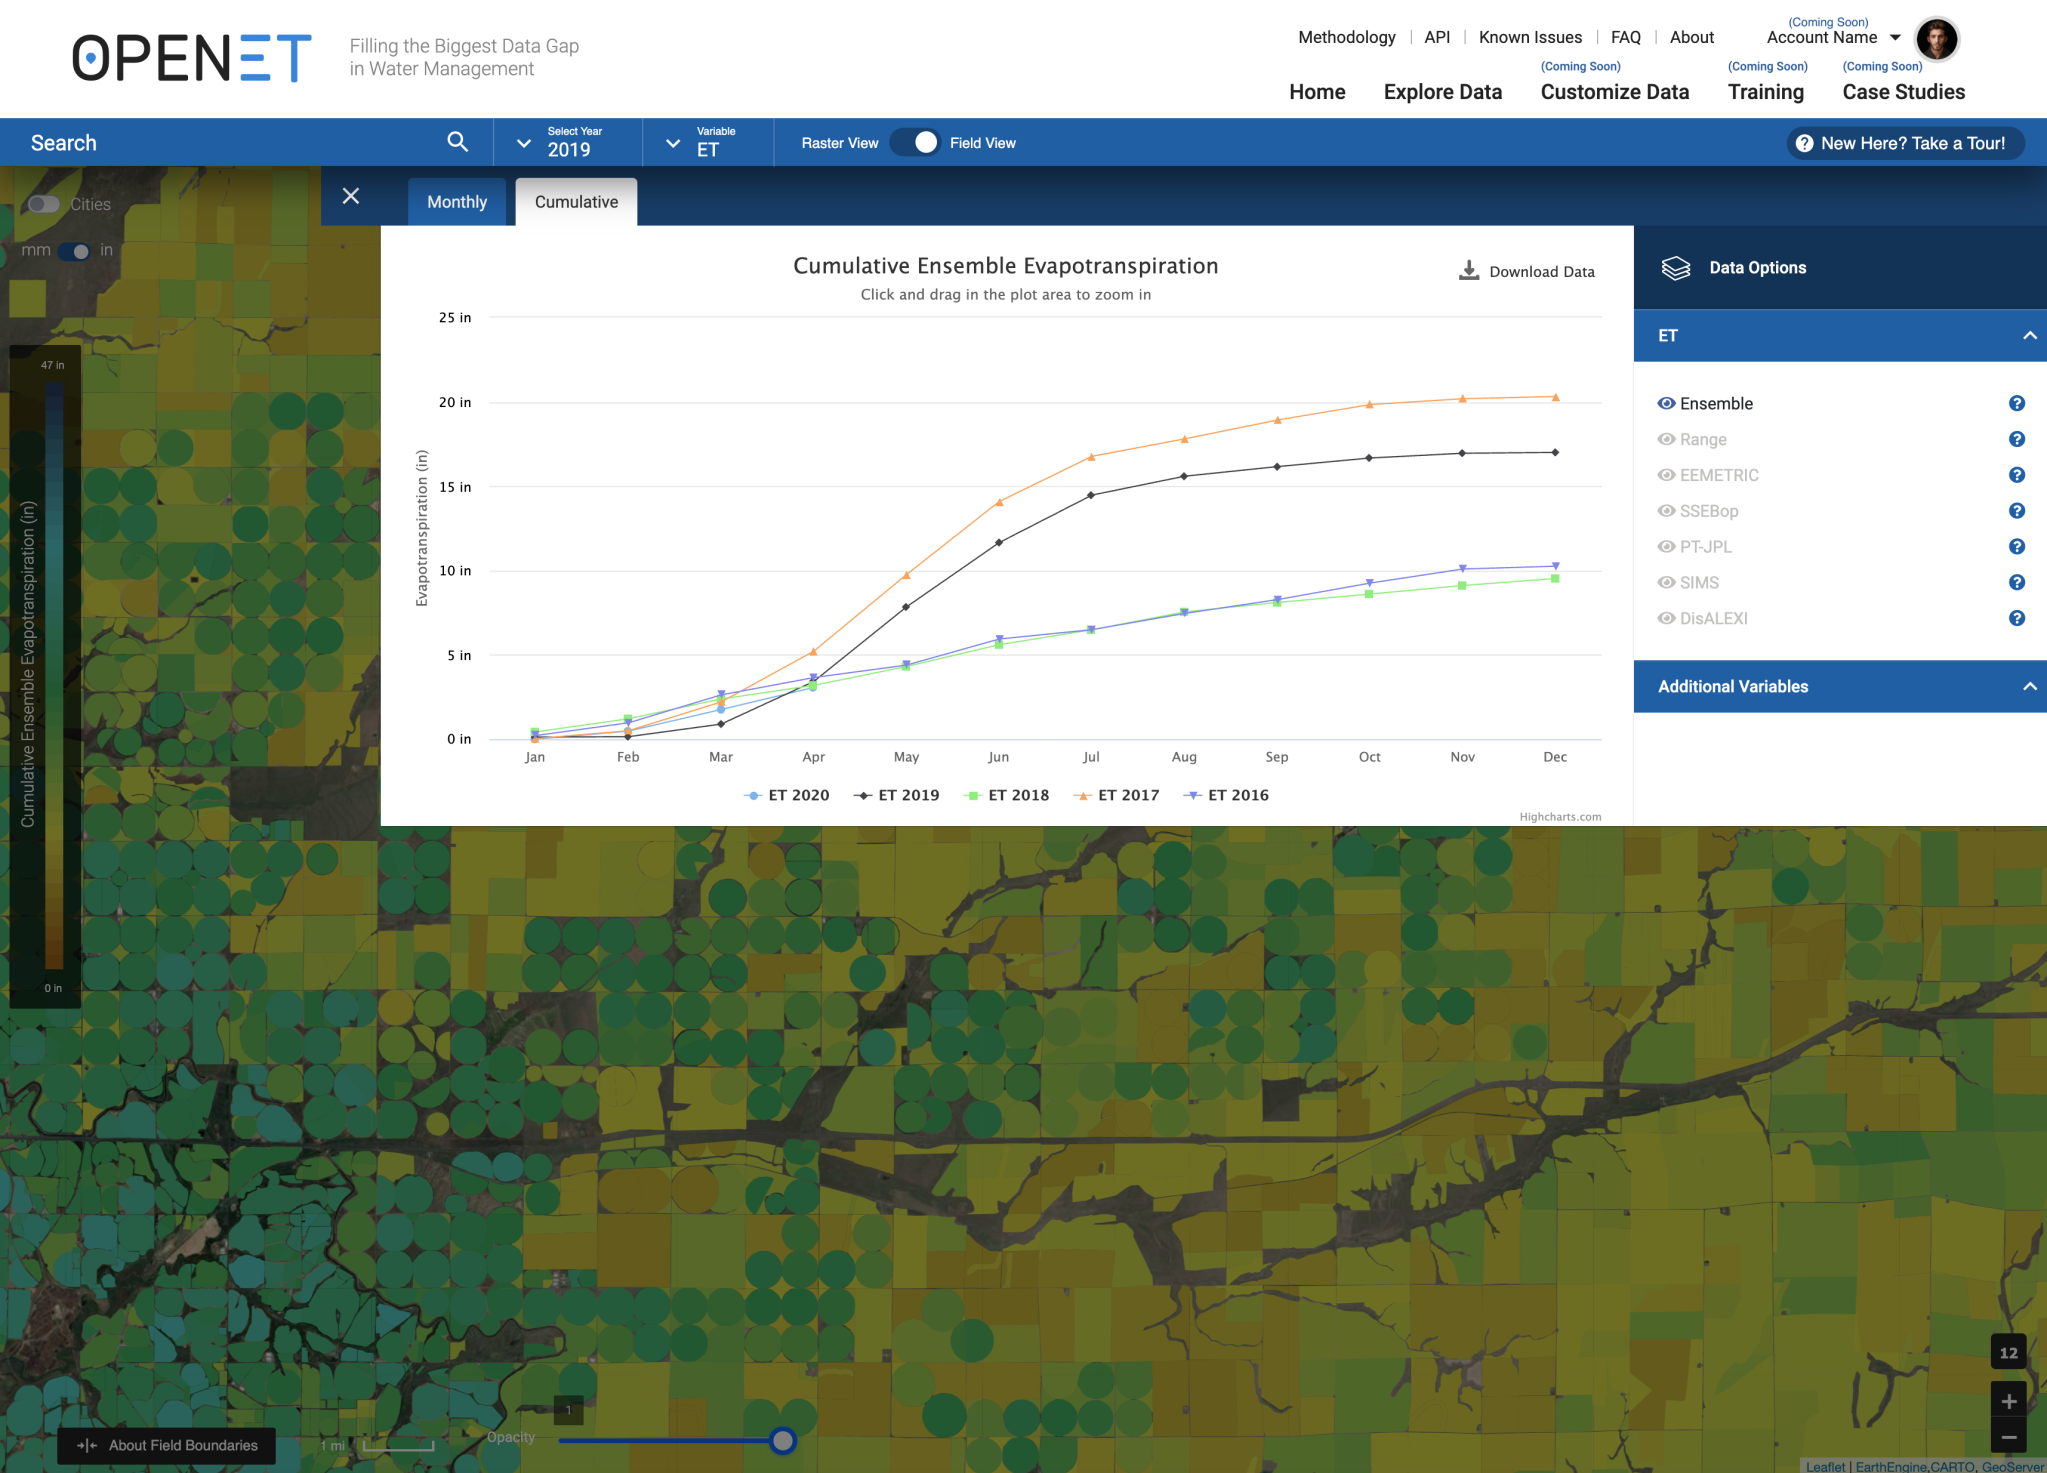
Building upon more than two decades of research, a new web-based platform called OpenET will soon be putting NASA data in the hands of farmers, water managers and conservation groups to accelerate improvements and innovations in water management. OpenET uses publicly available data and open source models to provide satellite-based information on evapotranspiration (the “ET” in OpenET) in areas as small as a quarter of an acre and at daily, monthly and yearly intervals.
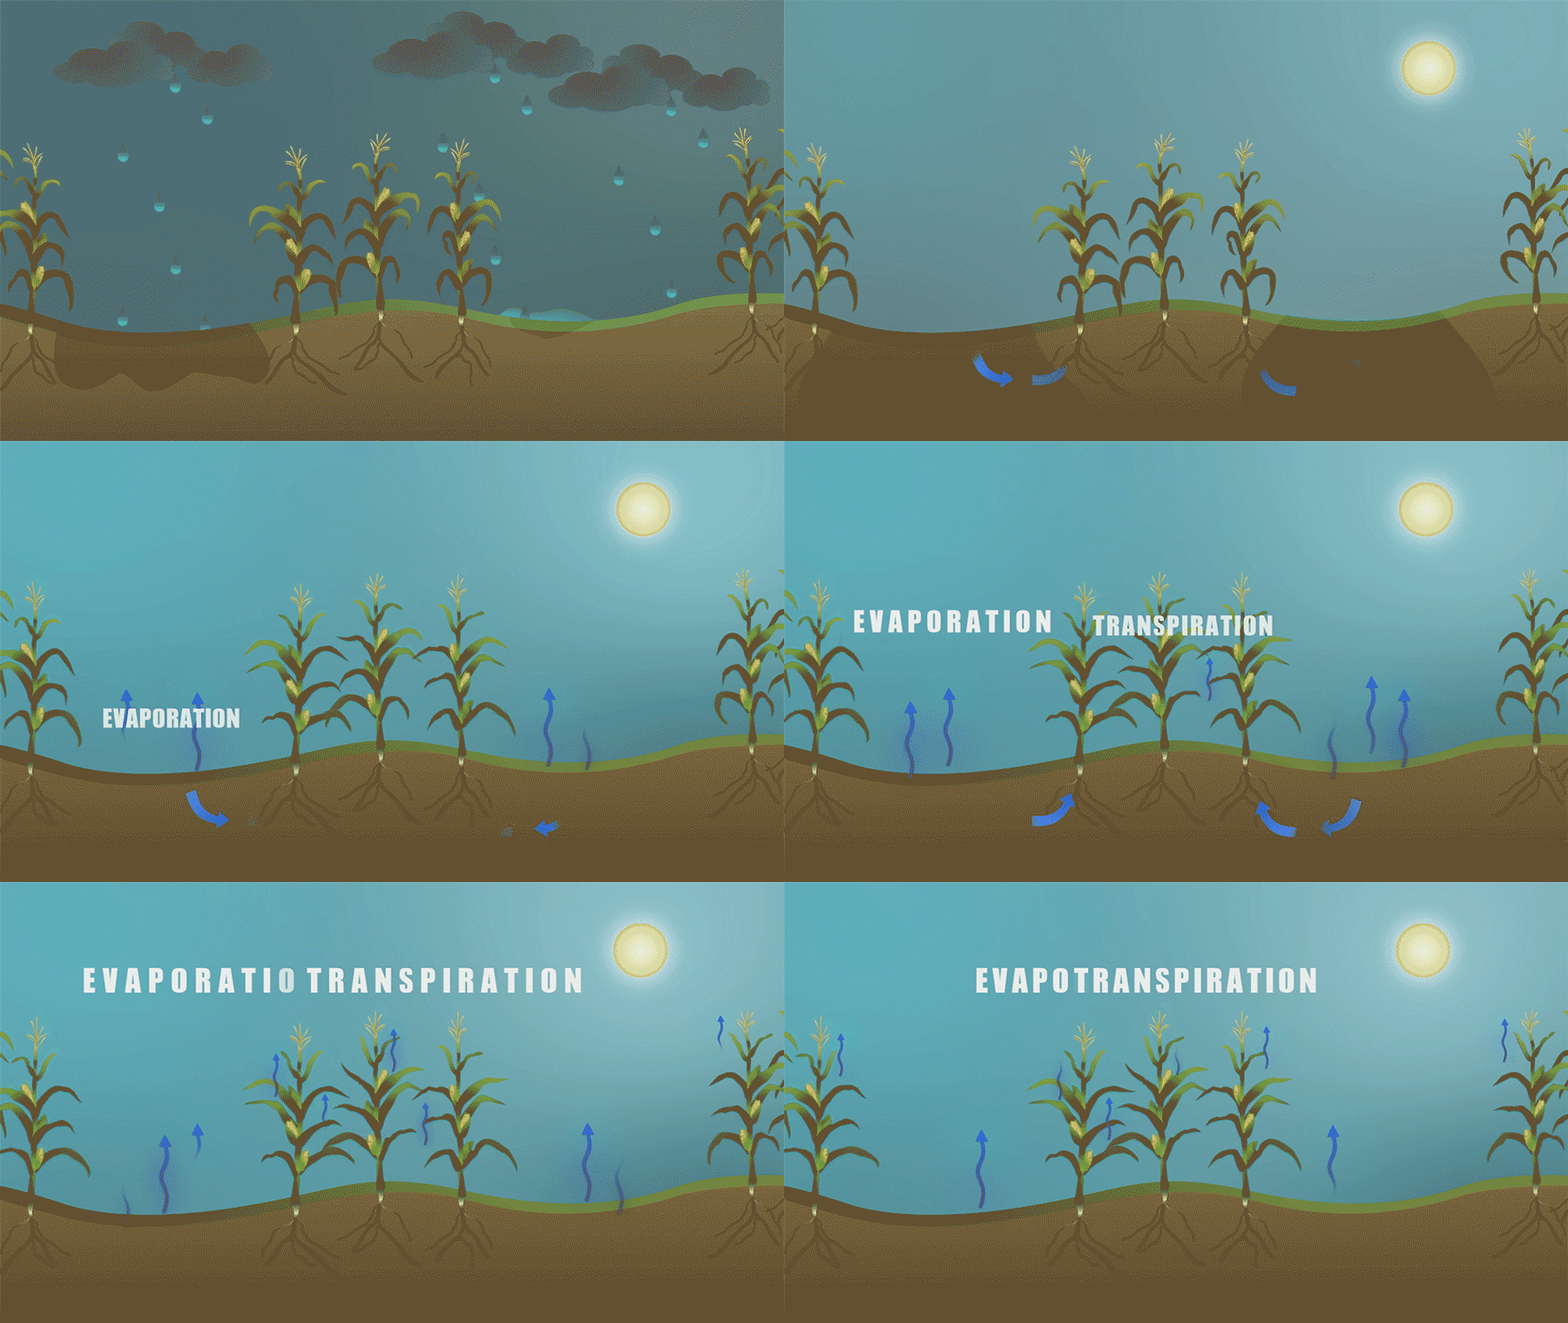
Evapotranspiration is the process by which water is transferred from the land to the atmosphere, by water leaving the soil (evaporation) and water lost through plant leaves and stems (transpiration). Evapotranspiration is an important measure of how much water is used or “consumed” by agricultural crops and other plants.
In the arid western United States, where the majority of water used by people is for irrigation to grow crops, having an accurate measure of evapotranspiration is critical to balancing water supplies and water demand. Until OpenET, there has not been an operational system for measuring and distributing evapotranspiration data at the scale of individual fields across the western United States. OpenET will be available to the public next year, supplying evapotranspiration data across 17 western states.
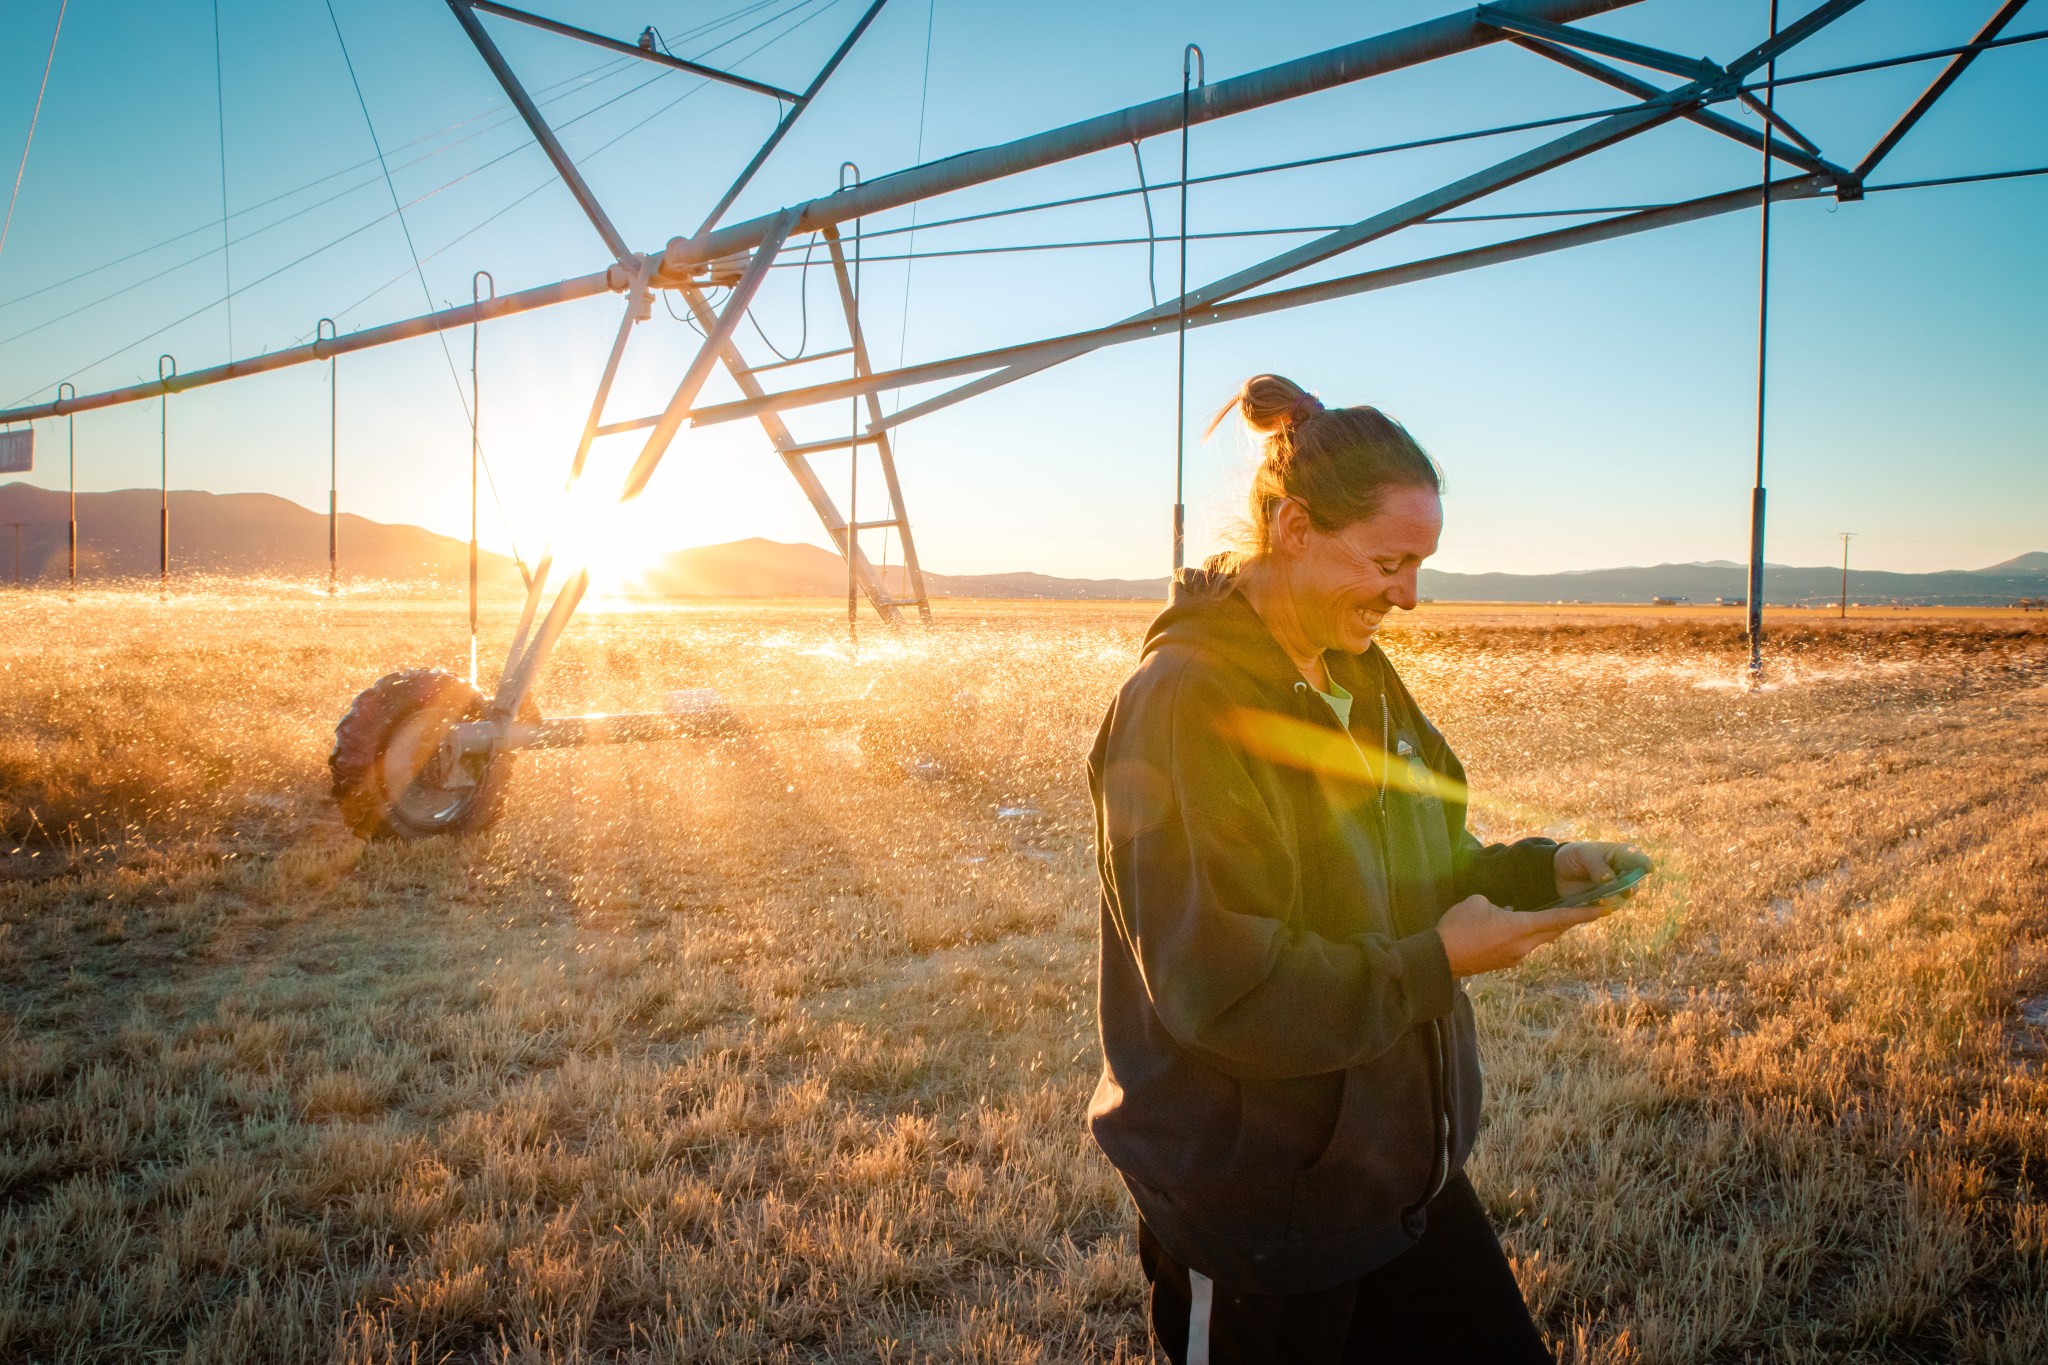
“What OpenET offers is a way for people to better understand their water usage and, more importantly, their water loss through evapotranspiration,” said Denise Moyle, an alfalfa farmer in Diamond Valley, Nevada, and an OpenET collaborator. “Giving farmers and other water managers better information is the greatest value of OpenET.”
The OpenET platform is being developed through a unique collaboration of scientists, farmers and water managers from across the western United States, as well as software engineers specializing in data access and visualization for large Earth observation datasets.
Led by NASA, the nonprofit Environmental Defense Fund (EDF), the Desert Research Institute (DRI) and data applications developer HabitatSeven, with funding from the Water Funder Initiative and in-kind support from Google Earth Engine, OpenET primarily uses satellite datasets from the Landsat program, which is a partnership between NASA and the U.S. Geological Survey (USGS). Additional data comes from NASA’s Terra and Aqua satellites, the National Oceanic and Atmospheric Administration (NOAA) GOES series of satellites and others.
“OpenET will empower farmers and water managers across the West to build more accurate water budgets and identify stress, resulting in a more resilient system for agriculture, people and ecosystems,” said Maurice Hall, head of EDF’s Western Water program. “We envision OpenET leveling the playing field by providing the same trusted data to all types of users, from the small farmer to regional water planners.”
California’s Delta Watermaster Michael George is responsible for administering water rights within the Sacramento-San Joaquin River Delta, which supplies drinking water to more than 25 million Californians and helps irrigate 3 million acres of farmland. For him, the development of OpenET signals an exciting opportunity for the future of water in the West.
“OpenET represents a game-changing leap forward for water management,” George said. “It will help landowners and water managers in the Bay-Delta save millions of dollars that would otherwise have to be spent on water meters to more accurately measure water use, as required by state law.”
In addition to helping Delta farmers save costs, OpenET data will improve water management in the area, according to Forrest Melton, program scientist for NASA’s Western Water Applications Office. He is also with the NASA Ames Research Center Cooperative for Research in Earth Science and Technology (ARC-CREST).
“The importance of careful, data-driven water management in the Delta and other regions can’t be overstated,” he explained. “In addition to supplying water for drinking and growing food, the Delta provides critical habitat for endangered species. For a water manager, trying to balance all of these demands is almost impossible without accurate, timely data.”
The OpenET team is currently collaborating with water users on several case studies across the West. In California’s Central Valley, the Rosedale-Rio Bravo Water Storage District is already starting to use OpenET data as the foundation for an online water accounting and trading platform to help farmers in the district manage groundwater sustainably. In Colorado, high-altitude ranchers will be using OpenET as they experiment with different irrigation strategies to conserve water.
Landsat science team member Justin Huntington of DRI emphasized the value of getting this type of early feedback on the OpenET system from future users. “Working closely with farmers and water managers on the design of OpenET has given us invaluable insights into how to best make ET data available to support water management in Diamond Valley and other basins across the West,” he said.
Because the OpenET system uses open source software and open data sources, it will help water managers establish an agreed upon measure of evapotranspiration across agricultural areas, said Melton. Different estimates of evapotranspiration have previously been a source of confusion for water managers, he said, explaining that water users and managers currently have to evaluate a variety of methodologies to measure water use and evapotranspiration, which often leads to different numbers and debates over accuracy.
OpenET provides a solution to those debates, said project manager Robyn Grimm. “OpenET brings together several well-established methods for calculating evapotranspiration from satellite data onto a single platform so that everyone who makes decisions about water can work from the same playbook, using the same consistent, trusted data,” said Grimm, who is also a senior manager at EDF.
The need for a resource like OpenET is also pressing beyond California and across the American West, Melton said.
“Our water supplies in the West are crucial to providing food for the country and beyond, and yet these supplies are under increasing levels of stress,” Melton said. “OpenET will provide the data we need to address the challenge of water scarcity facing many agricultural regions around the world and ensure we have enough water for generations to come.”
NASA Funds Eight New Projects Exploring Connections Between the Environment and COVID-19
by Elizabeth Goldbaum
While scientists around the world are confined to their homes during the COVID-19 pandemic, Earth observing satellites continue to orbit and send back images that reveal connections between the pandemic and the environment. “Satellites collect data all the time and don’t require us to go out anywhere,” Hannah Kerner, an assistant research professor at the University of Maryland in College Park, said.
Kerner is among eight researchers recently awarded a rapid-turnaround project grant, which supports investigators as they explore how COVID-19 lockdown measures are impacting the environment and how the environment can affect how the virus is spread.
The newest group of projects includes six that are looking to satellite images to help reveal how COVID-19 lockdown measures are impacting food security, fire ecology, urban surface heat, clouds and warming, air pollution and precipitation, and water quality and aquatic ecosystems. Two projects are exploring how the environment could be impacting how the virus is spread by monitoring dust and weather.
NASA’s Earth Science Division manages these projects that find new ways to use Earth observing data to better understand regional-to-global environmental, economic, and societal impacts of the COVID-19 pandemic.
Counting crops during COVID
This year was looking to be a relatively normal year for crops until the pandemic and associated lockdown policies happened. Reduced air and ground travel caused the demand for ethanol to plummet, which caused corn prices to decline. Lockdown policies also made it harder for officials from the U.S. Department of Agriculture (USDA) to travel to farms and collect information about crop planting, progress, and conditions.
The subsequent lack of public information about crops caused uncertainty and volatility in agricultural markets and prices as growing seasons progressed. “Markets want to know how much of a specific kind of crop to expect,” Kerner said.
Kerner and her team are looking to satellite data from NASA’s and the U.S. Geological Survey’s Landsat, ESA’s (the European Space Agency) Copernicus Sentinel-2, NASA’s Moderate Resolution Imaging Spectroradiometer (MODIS) aboard the Terra and Aqua satellites, and Planet’s satellites to help supplement USDA’s information.
“We’re using satellite data and machine learning to map where and which crops are growing,” Kerner said. Specifically, they’re monitoring key commodity crops, which are corn and soybeans in the U.S. and winter wheat in Russia.
Starting and stopping fires during lockdown
There are far fewer intentional fires to boost biodiversity and reduce fuel loads in the Southeast this spring.
As COVID-19 lockdowns went into effect, the U.S. Forest Service temporarily suspended all of its intentional, or prescribed, burns on federal lands in the Southeast in March, and state agencies in Mississippi, South Carolina, and North Carolina followed suit.
Ben Poulter, a research scientist at NASA’s Goddard Space Flight Center in Greenbelt, Maryland, is using the Visible Infrared Imaging Radiometer Suite (VIIRS) on NASA and NOAA’s Suomi NPP satellite, as well as data from MODIS, to track fires across the country and better understand how COVID-19 social distancing policies, like federal travel restrictions, have affected both prescribed burns on the East Coast and wildfires in the West.
Ultimately, his team wants to better understand how fewer fires in the Southeast could be affecting biodiversity, since some species rely on fires to thrive, and causing fuels to accumulate in vegetation, potentially leading to more dangerous wildfires in the future.
On the other side of the country, the team is examining how COVID-19 policies are complicating fire suppression. As firefighting agencies have introduced social distancing practices to minimize the spread of COVID-19, like eliminating large camps of firefighters living in close quarters, Poulter said, “it may become more difficult to fight fires in the Western states.”
The team is also looking at how the total number of fires across the country could affect atmospheric chemistry. It will work with air quality scientists to determine if there will be an overall net increase or decrease in total carbon dioxide, among other pollutants, from wildfires in the West and prescribed fires in the East.
Fewer cars might mean hotter surfaces
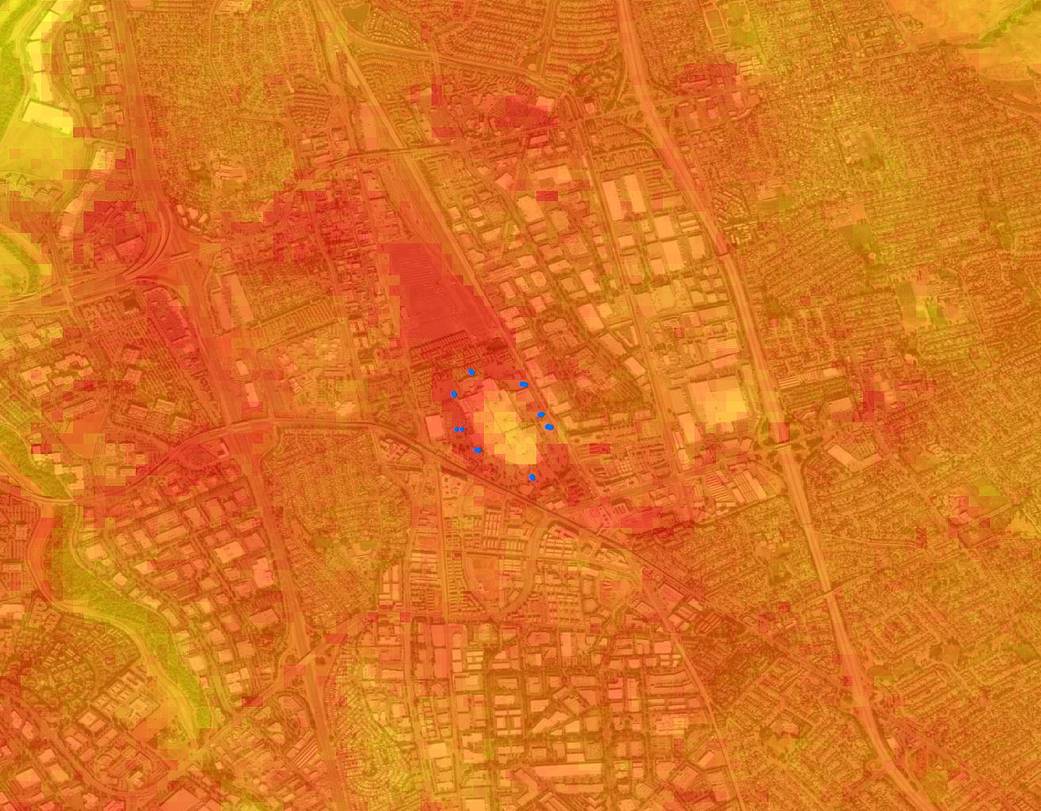
Christopher Potter, a research scientist at NASA’s Ames Research Center in California’s Silicon Valley, is looking at how California’s shelter-in-place mandate in the San Francisco Bay Area has reduced the number of cars on the road and changed how parking lots, highways, and large industrial buildings’ surfaces absorb sunlight and reflect infrared heat.
“It suddenly got so quiet,” Potter said, “There was no traffic anywhere in late March and April.”
Potter and his team are monitoring parking lots and other surfaces to see if they are hotter or cooler during the pandemic. Visible light from the sun hits the surface and then is absorbed and reradiated as heat – a process called thermal heat flux.
The team is using satellite thermal infrared sensor brightness temperatures from Landsat and land surface temperature from ECOSTRESS, which is a NASA sensor on the International Space Station, to map out large, flat urban features in the Bay Area and measure their thermal heat flux. He’s also gathering on-the-ground measurements to ground truth the data.
Potter is asking questions like, if automobiles are parked and concentrated in giant lots, do you change the reflectance of the surface and the overall heat flux? Even shiny car windows may be enough to reflect sunlight, Potter said.
Potter and his team want to know how the entire Bay Area’s urban heat flux has changed during the pandemic, and how that change has contributed to a more or less healthy environment for the millions of people living in it. Understanding potential changes in the thermal heat flux is a key indicator of how COVID-19 has altered the Bay Area’s environmental footprint, Potter said.
Fewer planes and fewer clouds could make things cooler
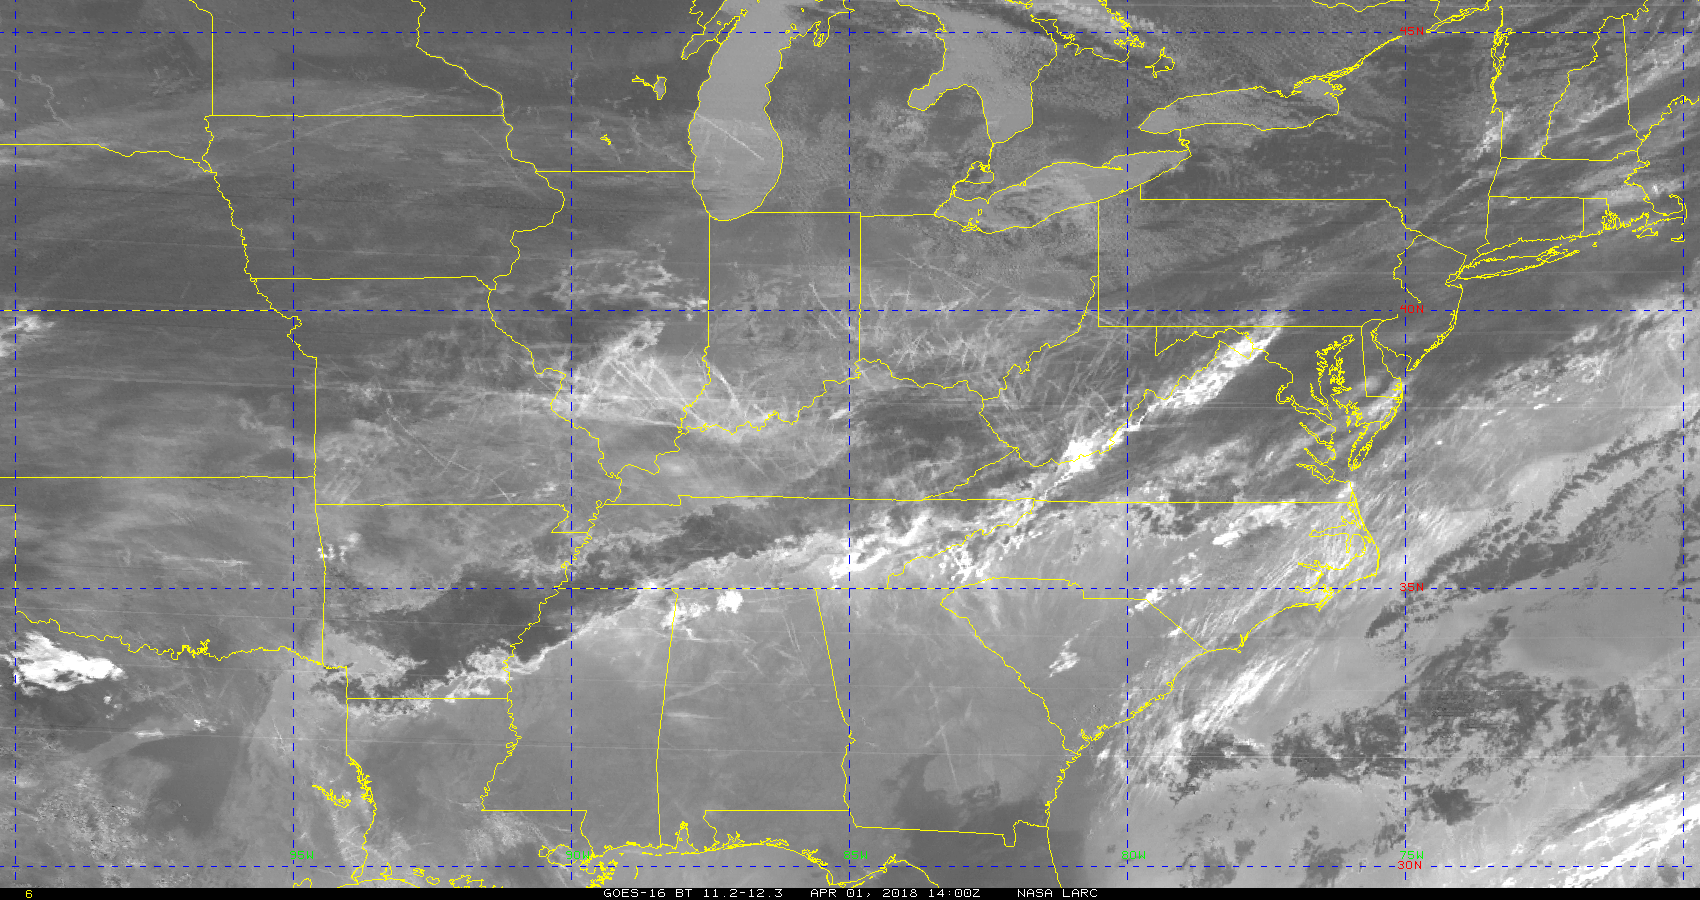
When you look up at a clear blue sky and the conditions are just right, you might see a plane soaring above and leaving behind a distinct white trail of clouds.
Those clouds, or contrails, are produced by aircraft engine exhaust or changes in air pressure. William Smith and Dave Duda, researchers at NASA’s Langley Research Center in Hampton, Virginia, have been studying contrails for a couple decades. “Contrails are one of the only clouds we produce ourselves,” Duda said. Although their effects vary and are difficult to quantify, their overall net effect is warming.
In response to COVID-19 travel bans and lockdown policies, we’re flying a lot less and producing fewer contrails. Duda and Smith want to quantify this decrease to better understand how air traffic density impacts contrail formation and its radiative forcing. In other words, are fewer planes and fewer contrails helping to cool the atmosphere?
The team is using an established contrail detection algorithm to estimate coverage over the contiguous United States and the North Atlantic air traffic corridor over the 2020 slowdown period and compare that to a baseline period a couple years earlier when air traffic was unrestricted. Duda and Smith are also using MODIS to determine contrail optical properties to better understand how they reflect sunlight and trap energy from the surface and atmosphere below them.
The atmosphere must be sufficiently cold and moist for a contrail to form, so there are typically more contrails during the winter and spring. “Not all contrails are equal,” Duda said. If one forms in the middle of clouds, it doesn’t have a significant impact. “You see the biggest impact when there’s an otherwise clear sky and a contrail adds cloudiness to it,” Duda said.
Improving our understanding of how and when contrails form could help scientists inform airlines on ideal routes to fly planes. “It might be possible to reduce contrails and their effects by making occasional flight altitude or routing adjustments much like the airlines do now to avoid turbulence,” Smith said.
Less air pollution may mean less rain
Gabriele Villarini, a professor at the University of Iowa in Iowa City, and Wei Zhang, a scientist in the same institute, want to understand the connection between reduced air pollution during the pandemic and sharp decreases in precipitation in the western U.S.
Moisture in the atmosphere condenses around aerosols, or particles like dust, and falls to Earth as rain and snow. Fewer aerosols during the pandemic may have been responsible for the reduced precipitation in February and March 2020 across the western U.S., with areas receiving less than 50% compared to a typical year. Understanding how the decrease in precipitation is related to reduced aerosols could be valuable to water resource managers.
Villarini is aiming to use NASA’s satellite data on water vapor, precipitation, and aerosols as well as a comprehensive climate model that can combine atmospheric conditions such as moisture and temperature with chemical properties and processes that take place in the atmosphere. The model will help his team pinpoint the extent to which the reduction in aerosols is responsible for the decrease in precipitation as opposed to the natural variability in the climate system.
“This project will help us understand how COVID-19 is impacting the natural environment,” Villarini said.
Finding a human imprint on water quality in Belize
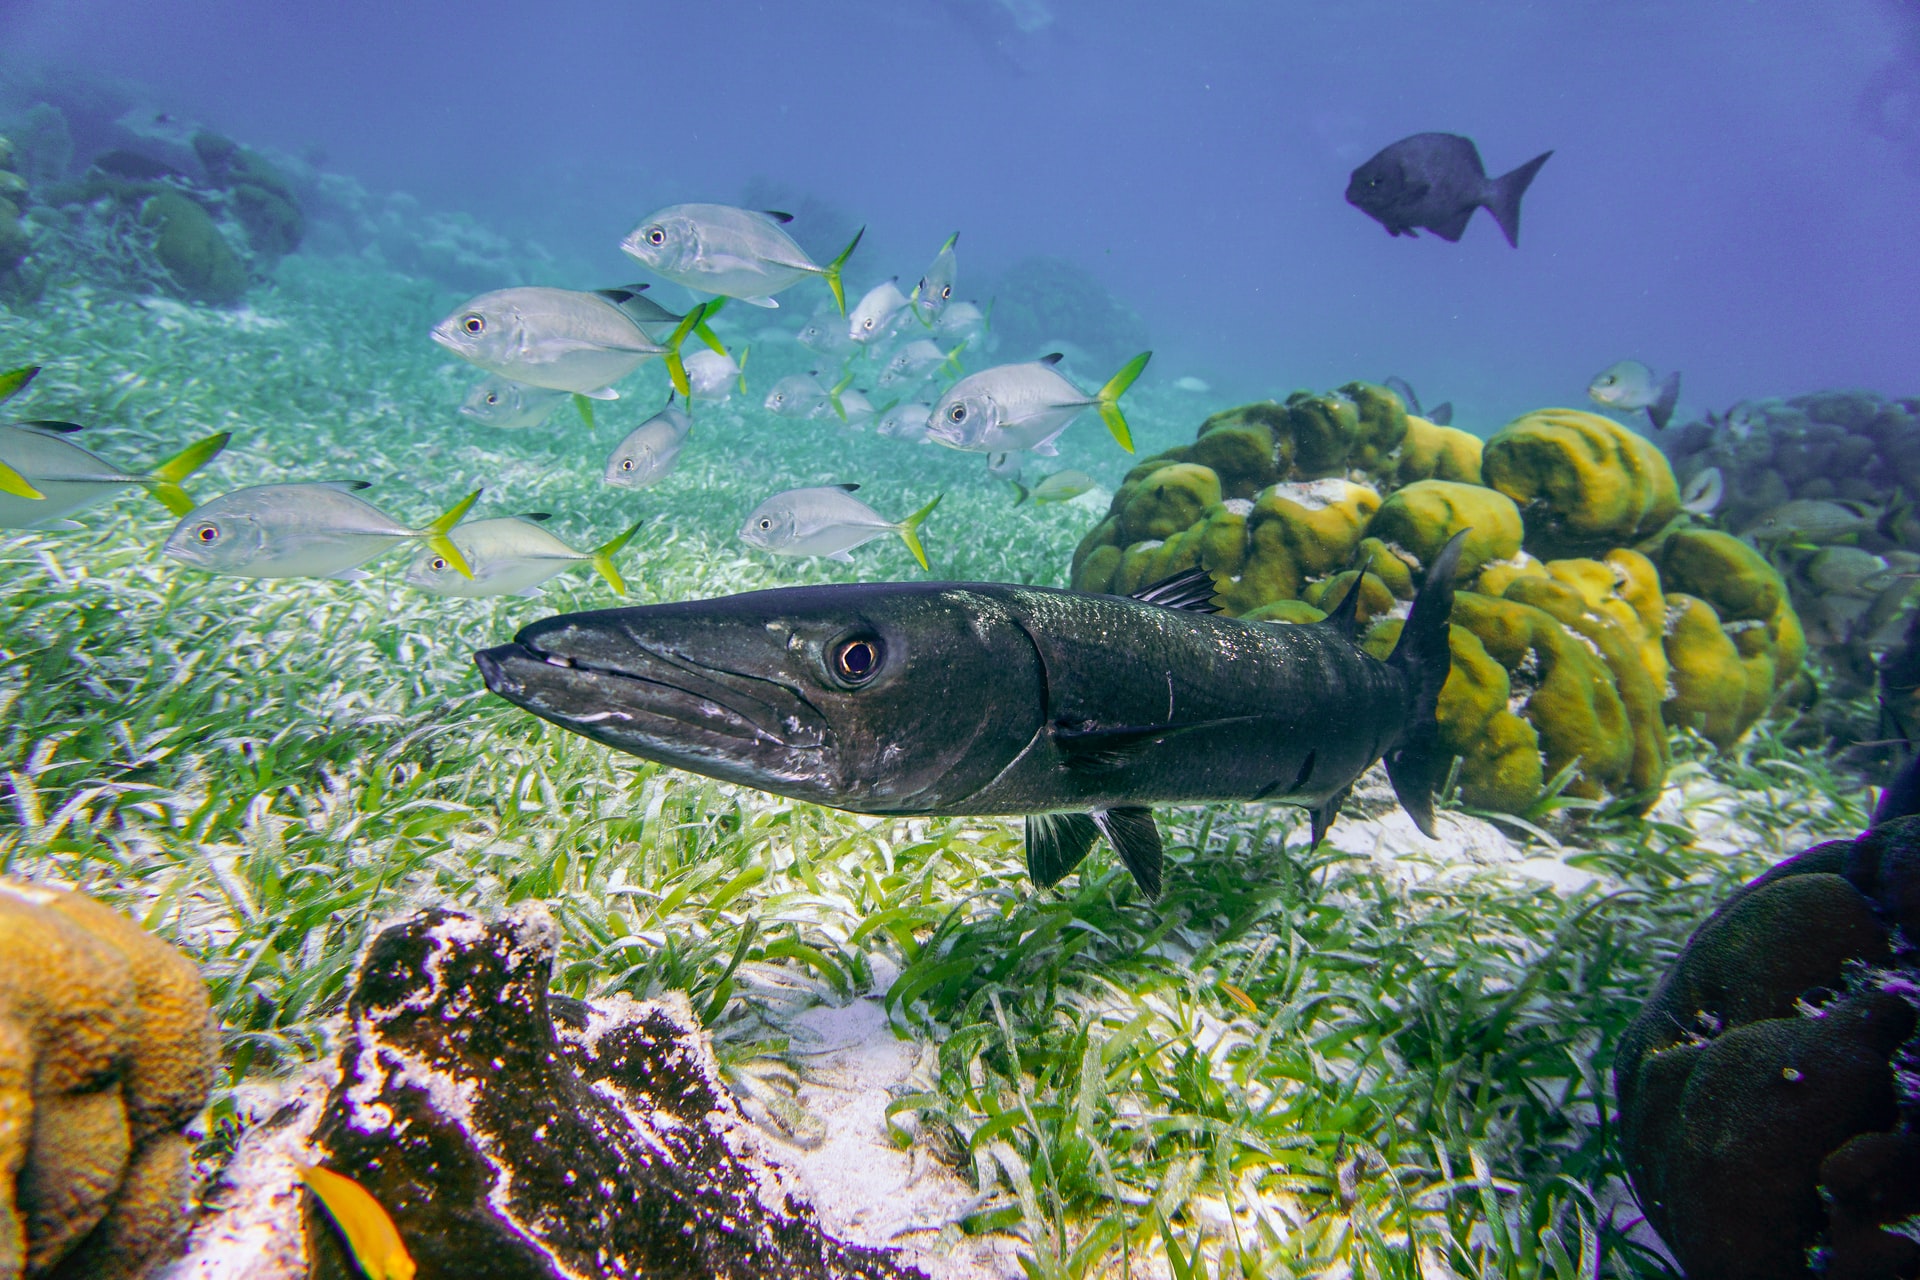
The coastal area of Belize includes the largest barrier reef in the Northern Hemisphere, offshore atolls, several hundred sand cays, mangrove forests, coastal lagoons, and estuaries. It is one of the most biodiverse ecosystems in the Atlantic and is home to colorful fish and playful sea turtles, many of which are endangered.
Robert Griffin, a professor at the University of Alabama in Huntsville, was working on a NASA project to study the reef’s health when COVID-19 happened. “The pandemic created a natural experiment,” Griffin said, to better understand how urban pollutants affect water quality and coral reef health.
Griffin and his team are studying how decreased tourism is impacting urban and agricultural sources of pollutants, such as nitrogen and phosphorus, to water quality off the coast of Belize.
In addition to on-the-ground data, the team is using Landsat images to note how the pandemic is affecting land use changes, which affects how many pollutants are produced and able to reach water bodies and ecosystems. Griffin is also using MODIS and VIIRS data to monitor water quality.
Griffin’s team is working with Belize government officials to help guide coastal marine development for the upcoming five years. “This research could provide guidance for land use planners as they determine how to deal with urban non-point sources of pollution,” like nutrients and sediments, that end up in the water and impact coral reef systems, Griffin said.
Dust storms, society, and COVID-19
Pablo Méndez-Lázaro, a professor at the University of Puerto Rico in San Juan, is examining how the environment could affect the spread of the novel coronavirus that causes COVID-19. More specifically, he wants to know if seasonal African dust that travels to the Caribbean between May and August every year will have significant impacts on health and mortality associated with the virus.
African dust travels from the Sahara Desert, across the Atlantic Ocean, to Puerto Rico and the Caribbean. Microorganisms in the dust particles can be linked to infectious diseases.
Méndez-Lázaro and his team are working with epidemiologists, among many specialists, to better understand how African dust impacts public health. “We see this as a Rubik’s Cube,” Méndez-Lázaro said, to demonstrate how his research is one of various moving parts to understand a larger issue. “Each tiny, colored cube is a different part of the puzzle,” focused on epidemiological research, societal studies, clinical studies, vaccine research, and environmental work, Méndez-Lázaro said.
The team is using VIIRS to measure aerosols in the atmosphere as a proxy for the dust clouds that arrive in the Caribbean. It’s also using MODIS and the European Commission’s Copernicus Atmosphere Monitoring System to characterize the aerosols.
Méndez-Lázaro is working closely with the Puerto Rico Department of Health, the National Weather Service’s San Juan Office, as well as physicians and patients, to gather information on people who have contracted respiratory diseases through contact with African dust.
“We believe that there could be an exacerbation of COVID-19 patients in the Caribbean during African dust events,” Méndez-Lázaro said, like the “Godzilla” event in June.
Weather, air quality, and COVID-19
Yulia R. Gel, a professor at the University of Texas at Dallas, and Huikyo Lee, a scientist at NASA’s Jet Propulsion Laboratory in Pasadena, California, along with other collaborators, want to help clarify what environmental factors could impact a second wave of COVID-19 cases and determine how certain we can be with those conclusions.
Her interdisciplinary team is studying whether surface air temperature and humidity are impacting transmission rates, and, if they are, how they are doing it. It’s also teasing out a potential link between aerosols and COVID-19 severity and mortality.
Gel and her collaborators are using weather data from the Atmospheric InfraRed Sounder on the Aqua satellite and Cross-track Infrared Sounder on the Suomi NPP satellite. The team will obtain aerosol data from the Multi-angle Imaging SpectroRadiometer and MODIS and use machine learning algorithms and advanced analyses to track the dynamics of the virus’s spread and its mortality rate over space and time.
More specifically, her team is using geometric deep learning algorithms, coupled with topological data analysis, which allow it to track COVID-19 transmission patterns that are driven, for instance, by different population characteristics, like age, gender, ethnicity, and income, as well as environmental factors. The advanced tools allow the team to consider factors that are not accessible using conventional approaches based on geographic proximity.
Gel aims to provide a powerful software tool to help predict the seasonal COVID-19 progression on a regional to global scale, while quantifying a broad range of associated uncertainties.
For more information, visit https://science.nasa.gov/earth-science/rrnes-awards

