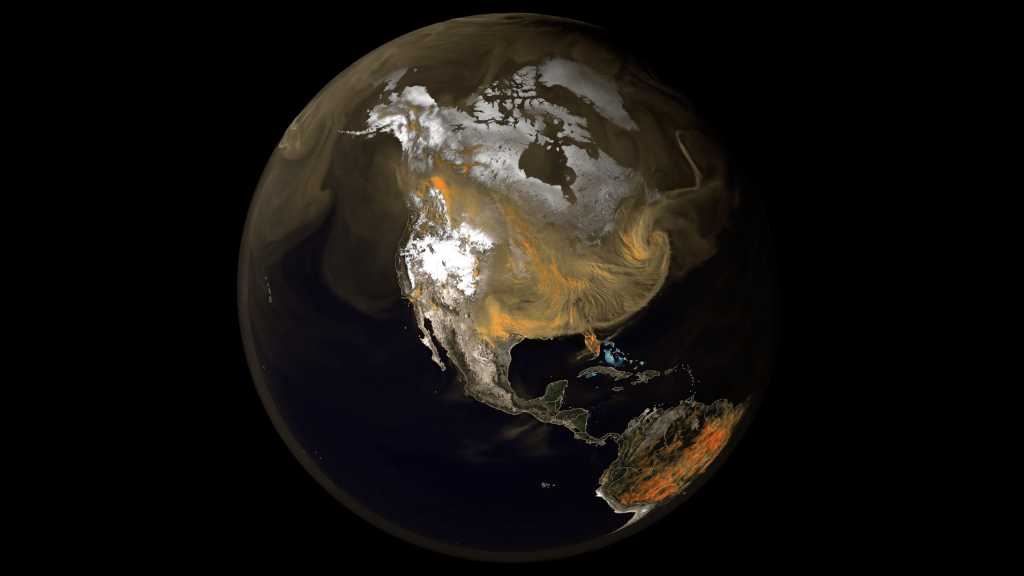
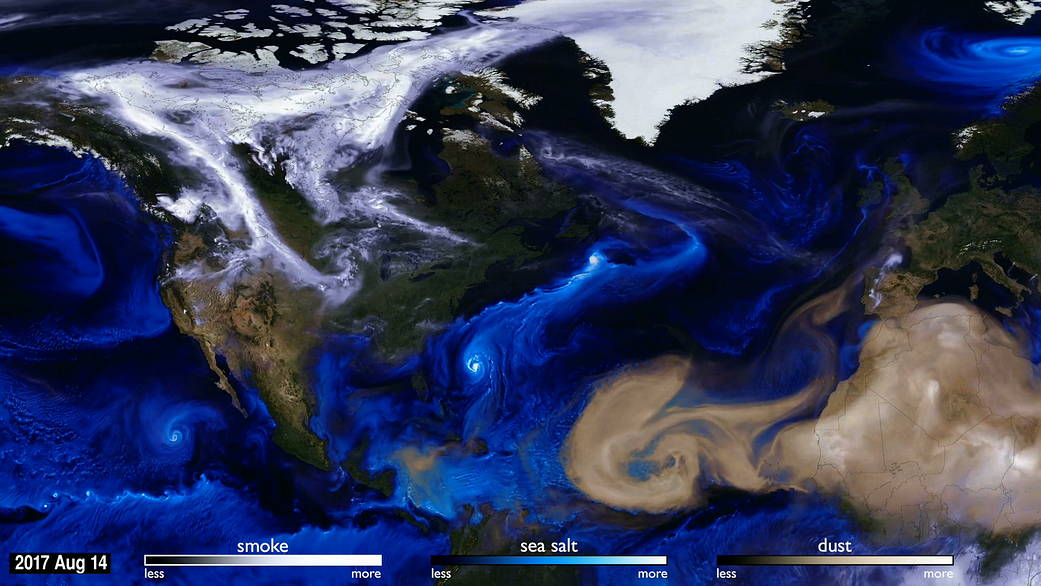
How can you see the atmosphere? The answer is blowing in the wind. Tiny particles, known as aerosols, are carried by winds around the globe. This visualization uses data from NASA satellites combined with our knowledge of physics and meteorology to track three aerosols: dust, smoke, and sea salt.
Sea salt, shown here in blue, is picked up by winds passing over the ocean. As tropical storms and hurricanes form, the salt particles are concentrated into the spiraling shape we all recognize. With their movements, we can follow the formation of Hurricane Irma and see the dust from the Sahara, shown in tan, get washed out of the storm center by the rain. Advances in computing speed allow scientists to include more details of these physical processes in their simulations of how the aerosols interact with the storm systems. The increased resolution of the computer simulation is apparent in fine details like the hurricane bands spiraling counter-clockwise. Computer simulations let us see how different processes fit together and evolve as a system.
By using mathematical models to represent nature we can separate the system into component parts and better understand the underlying physics of each. Today’s research improves next year’s weather forecasting ability. Hurricane Ophelia was very unusual. It headed northeast, pulling in Saharan dust and smoke from wildfires in Portugal, carrying both to Ireland and the UK. This aerosol interaction was very different from other storms of the season. As computing speed continues to increase, scientists will be able to bring more scientific details into the simulations, giving us a deeper understanding of our home planet.
Watch the video: https://www.youtube.com/watch?v=h1eRp0EGOmE
Image Credit: NASA’s Goddard Space Flight Center

