


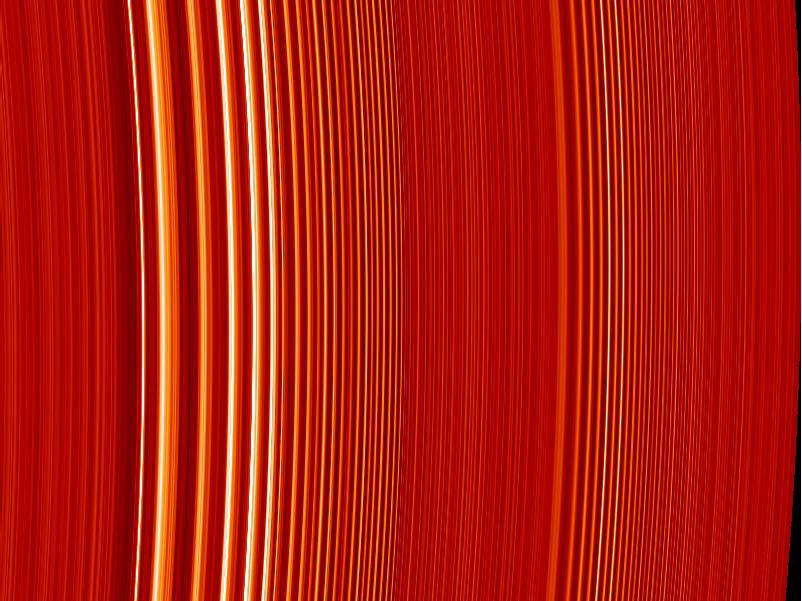
This false-color image of two density waves in Saturn's A ring was made by the Cassini-Huygens Ultraviolet Imaging Spectrograph instrument. Bright areas indicate the denser regions of the rings. Bright bands in the left part of the image are the 'peaks' of a density wave caused by gravitational stirring of the rings by Saturn's moon, Janus.
This false-color image of two density waves in Saturn’s A ring was made by the Cassini-Huygens Ultraviolet Imaging Spectrograph instrument.
Bright areas indicate the denser regions of the rings. The bright bands in the left part of the image are the ‘peaks’ of a density wave caused by gravitational stirring of the rings by Saturn’s moon, Janus. A smaller density wave in the right half of the image is produced by the moon Pandora.Image credit: NASA/JPL/Space Science Institute