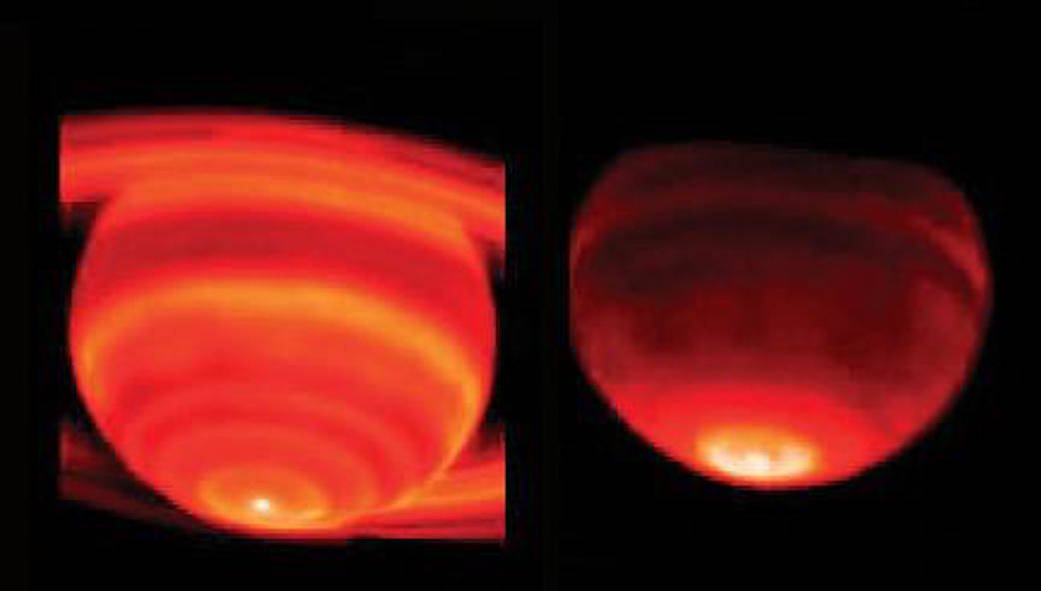
These side-by-side false-color images show Saturn’s heat emission. The data were taken on Feb. 4, 2004, from the W. M. Keck I Observatory, Mauna Kea, Hawaii. Both images were taken with infrared radiation. The image on the left was taken at a wavelength near 17.65 microns and is sensitive to temperatures in Saturn’s upper troposphere. The image on the right was taken at a wavelength of 8 microns and is sensitive to temperatures in Saturn’s stratosphere. The prominent hot spot at the bottom of each image is at Saturn’s south pole. The warming of the southern hemisphere was expected, as Saturn was just past southern summer solstice, but the abrupt changes in temperature with latitude were not expected.
The troposphere temperature increases toward the pole abruptly near 70 degrees latitude from 88 to 89 Kelvin (-301 to -299 degrees Fahrenheit) and then to 91 Kelvin (-296 degrees Fahrenheit) right at the pole. Near 70 degrees latitude, the stratospheric temperature increases even more abruptly from 146 to 150 Kelvin (-197 to -189 degrees Fahrenheit) and then again to 151 Kelvin (-188 degrees Fahrenheit) right at the pole.
While the rings are too faint to be detected at 8 microns (right), they show up at 17.65 microns. The ring particles are orbiting Saturn to the left on the bottom and to the right on the top. The lower left ring is colder than the lower right ring, because the particles are just moving out of Saturn’s shadow where they have cooled off. As they orbit Saturn, they warm up to a maximum just before passing behind Saturn again in shadow.Credit: NASA/JPL

